
Advanced Filtration and Carbon Adsorption...
Advanced Filtration...
We have defined filtration as a unit operation of separating solids or particles from fluids. A unit operation of
filtration carried out using membranes as filter media is advanced filtration. This chapter discusses advanced filtration
using electrodialysis membranes and pressure membranes. Filtration using pressure membranes include reverse osmosis,
nanofiltration, microfiltration, and ultrafiltration. In addition to advanced filtration, this chapter also discusses
carbon adsorption.
This is a unit operation that uses the active sites in powdered, granular, and fibrous activated carbon to remove
impurities from water and wastewater. Carbon adsorption and filtration share some similar characteristics. For example,
head loss calculations and backwashing calculations are the same. Carbon adsorption will be discussed as the last part of
this chapter.
Electrodialysis Membranes...
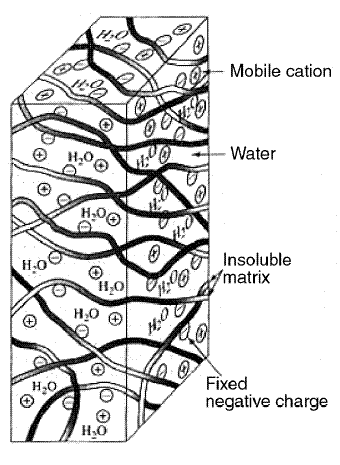
Figures located below shows a cut section of an electrodialysis filtering membrane. The filtering membranes are sheet-like
barriers made out of high-capacity, highly cross-linked ion exchange resins that allow passage of ions but not of water.
Two types are used: cation membranes, which allow only cations to pass, and anion membranes, which allow only anions to
pass. The cut section in the figure is a cation membrane composed of an insoluble matrix with water in the pore spaces.
Negative charges are fixed onto the insoluble matrix, and mobile cations reside in the pore spaces occupied by water. It
is the residence of these mobile cations that gives the membrane the property of allowing cations to pass through it.
These cations will go out of the structure if they are replaced by other cations that enter the structure. If the entering
cations came from water external to the membrane, then, the cations are removed from the water, thus filtering them out.
In anion membranes, the mechanics just described are reversed. The mobile ions in the pore spaces are the anions; the
ions fixed to the insoluble matrix are the cations. The entering and replacing ions are anions from the water external
to the membrane. In this case, the anions are filtered out from the water.
Cation filtering membrane...
The electrodialysis process...
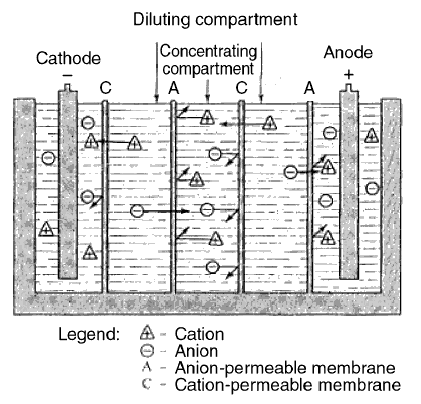
The next figure portrays the process of filtering out the ions in solution. Inside the tank, cation and anion membranes
are installed alternate to each other. Two electrodes are put on each side of the tank. By impressing electricity on
these electrodes, the positive anode attracts negative ions and the negative cathode attracts positive ions. This
impression of electricity is the reason why the respective ions replace their like ions in the membranes. As shown in
the figure, two compartments become "cleaned" of ions and one compartment (the middle) becomes "dirty" of ions. The two
compartments are diluting compartments; the middle compartment is a concentrating compartment. The water in the diluting
compartments is withdrawn as the product water, and is the filtered water. The concentrated solution in the concentrating
compartment is discharged to waste.
Power Requirement of Electrodialysis Units...
The filtering membranes in Figure shown above are arranged as CACA from left to right, where C stands for cation and A
stands for anion. In compartments CA, the water is deionized, while in compartment AC, the water is not deionized. The
number of deionizing compartments is equal to two. Also, note that the membranes are always arranged in pairs (i.e.,
cation membrane C is always paired with anion membrane A). Thus, the number of membranes in a unit is always even. If
the number of membranes is increased from four to six, the number of deionizing compartments will increase from two to
three; if increased from six to eight, the number of deionizing membranes will increase from three to four; and so on.
Thus, if m is the number of membranes in a unit, the number of deionizing compartments is equal to m / 2. As shown in
the figure, a deionizing compartment pairs with a concentrating compartment in both directions; this pairing forms a cell.
For example, deionizing compartment CA pairs with concentrating compartment AC in the left direction and with the
concentrating compartment AC in the right direction of CA. In this paring (in both directions), however, only one cell
is formed equal to the one deionizing compartment. Thus, the number of cells formed in an electrodialysis unit can be
determined by counting only the number of deionizing compartments. The number of deionizing compartments in a unit is
m / 2, so the number of cells in a unit is also equal to m / 2. Because one equivalent of a substance is equal to one
equivalent of electricity, in electrodialysis calculations, concentrations are conveniently expressed in terms of
equivalents per unit volume. Let the flow to the electrodialysis unit be Qo. The flow per deionizing compartment
or cell is then equal to Qo / (m / 2). If the influent ion concentration (positive or negative) is
[Co] equivalents per unit volume, the total rate of inflow of ions is [Co] Qo / (m / 2)
equivalents per unit time per cell. One equivalent is also equal to one Faraday. Because a Faraday or equivalent is equal
to 96,494 coulombs, assuming a coulomb efficiency of n, the amount of electricity needed to remove the ions in one cell is
equal to 96,494[Co] Qo n / (m / 2) coulombs per unit time. Coulomb efficiency is the fraction of the
input number of equivalents of an ionized substance that is actually acted upon by an input of electricity. If time is
expressed in seconds, coulomb per second is amperes. Therefore, for time in seconds, 96,494[Co] Qo
n / (m / 2) amperes of current must be impressed upon the membranes of the cell to effect the removal of the ions. The
cells are connected in series, so the same current must pass through all of the cells in the electrodialysis unit, and the
same 96,494[Co] Qo n / (m / 2) amperes of current would be responsible for removing the ions in the
whole unit. To repeat, not only is the amperage impressed in one cell but in all of the cells in the unit. In
electrodialysis calculations, a term called current density (CD) is often used. Current density is the current in
milliamperes that flows through a square centimeter of membrane perpendicular to the current direction : CD = mA /
Acm, where mA is the milliamperes of electricity and Acm is the square centimeters of perpendicular
area. A ratio called current density to normality (CD / N) is also used, where N is the normality. A high value of this
ratio means that there is insufficient charge to carry the current away. When this occurs, a localized deficiency of ions
on the membrane surfaces may occur. This occurrence is called polarization. In commercial electrodialysis units CD / N
of up to 1,000 are utilized. The electric current I that is impressed at the electrodes is not necessarily the same current
that passes through the cells or deionizing compartments. The actual current that successfully passes through is a function
of the current efficiency which varies with the nature of the electrolyte, its concentration in solution, and the membrane
system. Call M the current efficiency. The amperes passing through the solution is equal to the amperes required to remove
the ions. Thus,
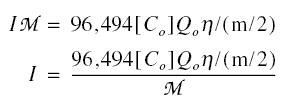
The emf E across the electrodes is given by Ohm’s law as shown below, where R is the resistance across the unit.

If I is in amperes and R is in ohms, then E is in volts.
From basic electricity, the power P is EI = ( I2 )( R ). Thus,

If I is in amperes, E is in volts, and R is in ohms, P in is in watts. Of course, the combined units of N and Q0
must be in corresponding consistent units.
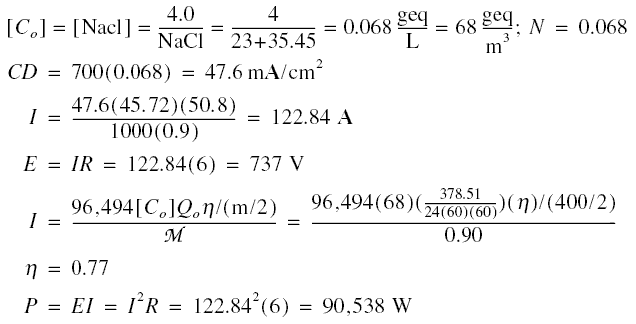
Example :A brackish water of 378.51 m3/day containing 4,000 mg/L of ions expressed as NaCl is to be
de-ionized using an electrodialysis unit. There are 400 membranes in the unit each measuring 45.72 cm by 50.8 cm.
Resistance across the unit is 6 ohms and the current efficiency is 90%. CD / N to avoid polarization is 700. Estimate
the impressed current and voltage, the coulomb efficiency, and the power requirement.
Solution :
Pressure Membranes...
Pressure membranes are membranes that are used to separate materials from a fluid by the application of high pressure on
the membrane. Thus, pressure membrane filtration is a high pressure filtration. This contrasts with electrodialysis
membranes in which the separation is effected by the impression of electricity across electrodes. Filtration is carried
out by impressing electricity, therefore, electrodialysis membrane filtration may be called electrical filtration.
According to Jacangelo (1989), three allied pressure-membrane processes are used: ultrafiltration (UF), nanofiltration
(NF), and reverse osmosis (RO). He states that UF removes particles ranging in sizes from 0.001 to 10 micro m, while RO can
remove particles ranging in sizes from 0.0001 to 0.001 micro m. As far as size removals are concerned, NF stays between UF
and RO, being able to remove particles in the size range of the order of 0.001 micro m. UF is normally operated in the range
of 100 to 500 kPag (kilopascal gage); NF, in the range of 500 to 1,400 kPag; and RO, in the range of 1,400 to 8,300 kPag.
Microfiltration (MF) may added to this list. MF retains larger particles than UF and operates at a lesser pressure
(70 kPag).
Whereas the nature of membrane retention of particles in UF is molecular screening, the nature of membrane retention in
MF is that of molecular-aggregate screening. On the other hand, comparing RO and UF, RO presents a diffusive transport
barrier. Diffusive transport refers to the diffusion of solute across the membrane. Due to the nature of its membrane,
RO creates a barrier to this diffusion. Figures located below present example installations of reverse osmosis units.
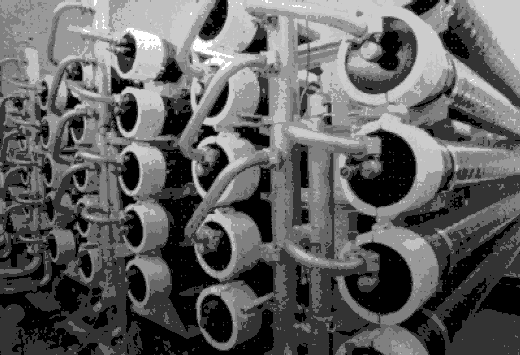
Bank of modules at the Sanibel–Captiva reverse osmosis plant, Florida...
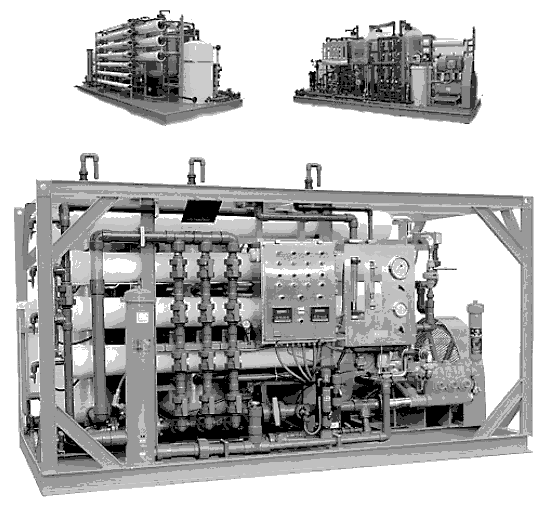
Installation modules of various reverse osmosis units...
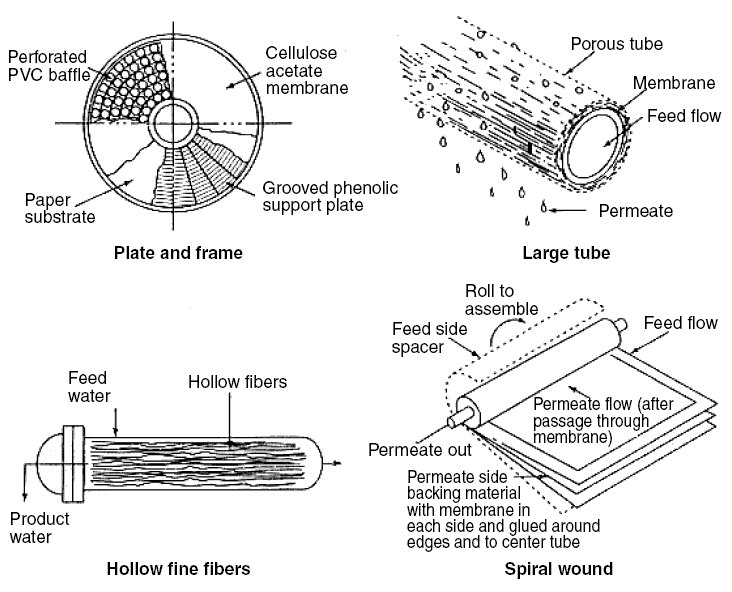
Reverse osmosis module designs...
The basics of a normal osmosis process are shown in figure located below. A bag of semipermeable membrane is shown placed
inside a bigger container full of pure water. Inside the membrane bag is a solution of sucrose. Because sucrose has osmotic
pressure, it “sucks” water from outside the bag causing the water to pass through the membrane. Introduction of the water
into the membrane bag, in turn, causes the solution level to rise as indicated by the height "pi" in the figure. The height
"pi" is a measure of the osmotic pressure. It follows that if sufficient pressure is applied to the tip of the tube in
excess of that of the osmotic pressure, the height "pi" will be suppressed and the flow of water through the membrane will
be reversed (i.e., it would be from inside the bag toward the outside into the bigger container); thus, the term “reverse
osmosis.” Sucrose in a concentration of 1,000 mg/L has an osmotic pressure of 7.24 kNa (kiloNewtons absolute). Thus, the
reverse pressure to be applied must be, theoretically, in excess of 7.24 kNa for a sucrose concentration of 1,000 mg/L.
For NaCl, its osmotic pressure in a concentration of 35,000 mg/L is 2744.07 kNa. Hence, toreverse the flow in a NaCl
concentration of 35,000 mg/L, a reverse pressure in excess of 2744.07 kNa should be applied. The operation just described
(i.e., applying sufficient pressure to the tip of the tube to reverse the flow of water) is the fundamental description of
the basic reverse osmosis process.
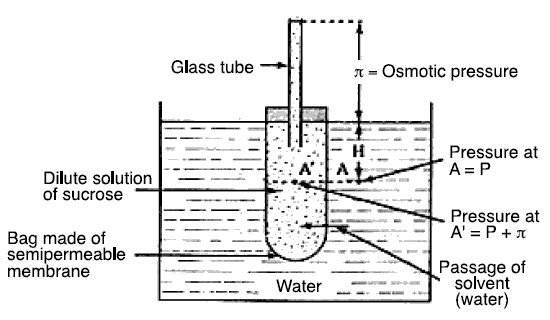
Osmosis process...
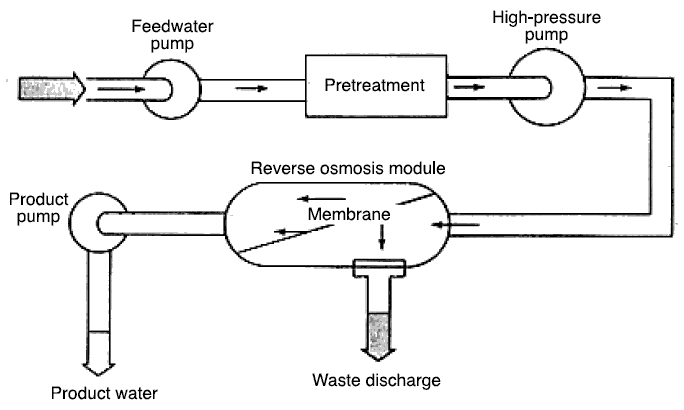
Reverse osmosis system...
UF, NF, MF, and RO and are all reverse osmosis filtration processes; however, when the term reverse osmosis or RO is used
without qualification, it is the process operated at the highest pressure range to which it is normally referred. The plant
in Florida treats water for drinking purposes. Take careful note of the pretreatment requirement indicated in figure shown
above. As mentioned before, the RO process is an advanced mode of filtration and its purpose is to remove the very minute
particles of molecules, ions, and dissolved solids. The influent to a RO plant is already “clean,” only that it contains
the ions, molecules, and molecular aggregates that need to be removed.
After pretreatment the high-pressure pump forces the flow into the membrane module where the solutes are rejected. The flow
splits into two, one producing the product water and the other producing the waste discharge. The waste discharge has one
drawback in the use of RO filtration in that it may need to be treated separately before discharge.
Membrane Module Designs...
Over the course of development of the membrane technology, RO module designs, as shown in figure located above, evolved.
They are tubular, plate-and-frame, spiral wound, and hollow fine-fiber modules. In the tubular design, the membrane is
lined inside the tube which is made of ordinary tubular material. Water is allowed to pass through the inside of the tube
under excess pressure causing the water to permeate through the membrane and to collect at the outside of the tube as the
product or permeate. The portion of the influent that did not permeate becomes concentrated. This is called the concentrate
or the reject. The plate-and-frame design is similar to the plate-and-frame filter press discussed in the previous chapter
on conventional filtration. In the case of RO, the semipermeable membrane replaces the filter cloth. The spiral-wound
design consists of two flat sheets of membranes separated by porous spacers. The two sheets are sealed on three sides; the
fourth side is attached to a central collector pipe; and the whole sealed sheets are rolled around the central collector
pipe. As the sheets are rolled around the pipe, a second spacer, called influent spacer, is provided between the sealed
sheets. In the final configuration, the spiral-wound sealed membrane looks like a cylinder. Water is introduced into the
influent spacer, thereby allowing it to permeate through the membrane into the spacer between the sealed membrane. The
permeate, now inside the sealed membrane, flows toward the central pipe and exits through the fourth unsealed side into
the pipe. The permeate is collected as the product water. The concentrate or the reject continues to flow along the
influent spacer and is discharged as the effluent reject or effluent concentrate. This concentrate, which may contain
hazardous molecules, poses a problem for disposal. In the hollow fine-fiber design, the hollow fibers are a bundle of
thousands of parallel, self-supporting, hair-like fibers enclosed in a fiberglass or epoxy-coated steel vessel. Water is
introduced into the hollow bores of the fibers under pressure. The permeate water exits through one or more module ports.
The concentrate also exits in a separate one or more module ports, depending on the design. All these module designs may
be combined into banks of modules and may be connected in parallel or in series.
Factors Affecting Solute Rejection and Breakthrough...
The reason why the product or the permeate contains solute (that ought to be removed) is that the solute has broken
through the membrane surface along with the product water. It may be said that as long as the solute stays away from
the membrane surface, only water will pass through into the product side and the permeate will be solute-free; However,
it is not possible to exclude the solute from contacting the membrane surface; hence, it is always liable to break through.
The efficiency at which solute is rejected is therefore a function of the interaction of the solute and the membrane
surface. As far as solute rejection and breakthrough are concerned, a review of literature revealed the following
conclusions (Sincero, 1989) ; (a) Percentage removal is a function of functional groups present in the membrane, (b)
Percentage removal is a function of the nature of the membrane surface. For example, solute and membrane may have the
tendency to bond by hydrogen bonding. Thus, the solute would easily permeate to the product side if the nature of the
surface is such that it contains large amounts of hydrogen bonding sites, (c) In a homologous series of compounds,
percentage removal increases with molecular weight of solute, (d) Percentage removal is a function of the size of the
solute molecule and (e) Percentage removal increases as the percent dissociation of the solute molecule increases. The
degree of dissociation of a molecule is a function of pH, so percentage removal is also a function of pH.
This review also found that the percentage removal of a solute is affected by the presence of other solutes. For example,
methyl formate experienced a drastic change in percentage removal when mixed with ethyl formate, methyl propionate, and
ethyl propionate. When alone, it was removed by only 14 % but when mixed with the others, the removal increased to 66 %.
Therefore, design of RO processes should be done by obtaining design criteria utilizing laboratory or pilot plant testing
on the given influent.
Solute – Water Separation Theory...
The sole purpose of using the membrane is to separate the solute from the water molecules. Whereas MF, UF, and NF may be
viewed as similar to conventional filtration, only done in high-pressure modes, the RO process is thought to proceed in
a somewhat different way. In addition to operating similar to conventional filtration, some other mechanisms operate
during the process. Several theories have been advanced as to how the separation in RO is effected. Of these theories,
the one suggested by Sourirajan with schematics shown in figures given below is the most plausible. Sourirajan’s theory
is called the preferential-sorption, capillary-flow theory. This theory asserts that there is a competition between the
solute and the water molecules for the surface of the membrane. Because the membrane is an organic substance, several
hydrogen bonding sites exist on its surface which preferentially bond water molecules to them. (The hydrogen end of water
molecules bonds by hydrogen bonding to other molecules.) As shown in figure, H2O molecules are shown layering
over the membrane surface (preferential sorption), to the exclusion of the solute ions of Na+ and
Cl-. Thus, this exclusion brings about an initial separation. In the figure, a pore through the membrane
is postulated, accommodating two diameters of water molecules. This pore size designated as 2t, where t is the diameter
of the water molecule, is called the critical pore diameter. With this configuration, the final separation of the water
molecules and the solutes materializes by applying pressure, pushing H2O through the pores (capillary flow).
As the process progresses, solutes build and line up near the membrane surface creating a concentration boundary layer.
This layer concentration is much larger than in the bulk solution and, also, much larger, of course, than the concentration
in the permeate side. This concentration difference creates a pressure for diffusive transport. The membrane, however,
creates a barrier to this diffusion, thus, retaining the solute and not allowing it to pass through easily. Eventually,
however, the solute will diffuse out and leak to the permeate side.
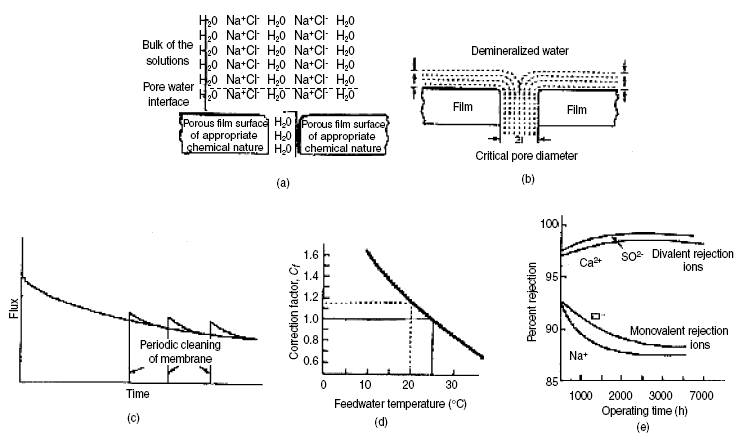
(a) Schematic representation of preferential sorption-capillary flow theory, (b) Critical pore diameter for separation,
(c) Flux decline with time, (d) Correction factor for surface area of cellulose acetate and (e) Solute rejection as a
function of operating time...
Types of Membranes...
The first RO membrane put to practical use was the cellulose acetate membrane (CA membrane). The technique of preparation
was developed by Sourirajan and Loeb and consisted of casting step, evaporation step, gelation step, and shrinkage step.
The casting step involves casting a solution of cellulose acetate in acetone containing an additive into flat or tubular
surfaces. The additive (such as magnesium perchlorate) must be soluble in water so that it will easily leach out in the
gelation step creating a porous film. After casting, the solvent acetone is evaporated. The material is then subjected to
the gelation step where it is immersed in cold water. The film material sets to a gel and the additive leaches out.
Finally, the film is subjected to the shrinkage step that determines the size of the pores, depending upon the temperature
used in shrinking. High temperatures create smaller pores.
After this first development of the CA membrane, different types of membranes followed: CAB, CTA, PBIL, and PA membranes.
CAB is membrane of cellulose acetate butyrate; CTA is cellulose triacetate. The PBIL membrane is a polybenzimidazolone
polymer and PA are polyamide membranes. The structure of a PBIL unit is as follows :

Polyethylene amine reacted with tolylene diisocyanate produces the NS-100 membrane (NS stands for nonpolysaccharide). The
reaction is carried out as follows :
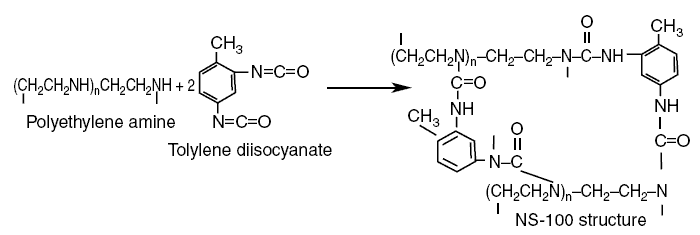
In this reaction, the H bonded to the N of the n repeating units of polyethylene amine
[(-CH2CH2NH)n-] moves to the N of tolylene diisocyanate [-N=C=O] destroying
the double bond between N and C. The C of the carboxyl group [=C=O] of tolylene diisocyanate then bonds with the
N of the amine. The reaction above simply shows two of the tolylene molecules participating in the reaction, but in
reality, there will be millions of them performing the reaction of H moving and the C of the carboxyl group of the
tolylene bonding with the N of the amine and so on. The final structure is a mesh of cross-linked assembly, thus
creating molecular pores. As indicated in the NS-100 product, a closed loop structure is formed. The ethylene repeating
units [-CH2CH2-] form the backbone of the membrane, and the benzene rings form the cross-linking
mechanism that tie together the ethylene backbones forming the closed loop. The ethylene units and the benzene rings are
nonpolar regions, while the peptide bonds and the amines [-NH2] are polar regions. In the NS-100, nonpolar
regions exceed the polar regions; hence, this membrane is said to be apolar. The CA membrane contains the OH-
and the acetyl groups. The OH- region exceeds the acetyl region in the membrane. OH- is polar,
while the acetyl group is nonpolar regions. Since the OH- region exceeds the acetyl region, CA membranes are
polar. The polarity or apolarity of any membrane is very important in characterizing its property to reject solutes.
Polyethylene amine reacted with isophthaloyl chloride produces the PA-100 membrane as shown in the following reaction :

The chloride atom in isophthaloyl chloride is attached to the carboxyl group. In this reaction, the H in the amine group
of polyethylene amine reacts with the chloride in the carboxyl group producing HCl, as shown by the product over the
arrow, and the PA-100 membrane to the right of the reaction equation. As in the case of the NS-100, the reaction forms
the closed loop resulting in cross-linked structure of the PA-membrane. Thus, a molecular pore is again produced. Epiamine,
a polyether amine, reacting with isophthaloyl chloride produces the PA-300 membrane as shown in the following reaction :

Again, in this reaction, the H in the amine group of the amine, epiamine, reacts with the chloride of isophthaloyl
chloride forming HCl. The N, in turn, of the amine group, from which the H that reacts with the C chloride were taken,
bonds with the C of the carboxyl group of isophthaloyl chloride producing the PA-300 membrane. As shown in its structure,
this membrane is also a cross-linked membrane. meta-Phenylene diamine reacting with trimesoyl chloride produces
the FilmTec FT-30 membrane according to the following reaction :
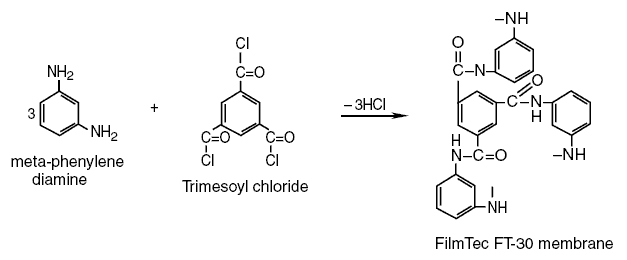
2-Hydroxy-methyl furan when dehydrated using H2SO4 produces the NS-200 according to the following
reaction :

Another membrane formed from 2-hydroxy-methyl furan is Toray PEC-1000. The PAs in the prefixes for the naming of the
membranes stand for polyamide. Thus, the membranes referred to are polyamide membranes. PA membranes contain the amide
group; it is for this component that they are called polyamide membranes. The formulas for the NS-100, NS-300, and the
FT-30 membranes contain the amide group, thus, they are polyamide membranes. The NS-200 is not a polyamide membrane. In
the early applications of the reverse osmosis technique, the membranes available were the polysaccharide membranes such
as the CA membrane. As new membranes were developed, they were differentiated from the saccharide membranes by calling
them nonpolysaccharide membranes. Thus, the NS-200 is a nonpolysaccharide membrane.
Membrane Performance Characterization...
The performance of a given membrane may be characterized according to its product flux and purity of product. Flux, which
is a rate of flow per unit area of membrane, is a function of membrane thickness, chemical composition of feed, membrane
porosity, time of operation, pressure across membrane, and feedwater temperature. Product purity, in turn, is a function
of the rejection ability of the particular membrane. Figure located above shows the decline of the flux with time of
operation. This curve applies to a given membrane and membrane pressure differential. The lower solid curve is the actual
decline without the effect of cleaning. The saw-toothed configuration is the effect of periodic cleaning. As shown, right
after cleaning, the flux rate shows an improvement, but then, it begins to decline again with time. From experience, the
general trend of the curve plots a straight line in a log–log paper. Thus, empirically, the following equation fits the
curve :

where F is the flux, t is the time, m is the slope of the line, and K is a constant. The previous equation is a
straight-line equation between lnt and lnF. The equation is that of a straight line, so only two data points for lnt and
lnF are required to calculate the constants m and K. Using the techniques of analytic geometry as applied to straight-line
equations, the following equations are produced from equation given just above.
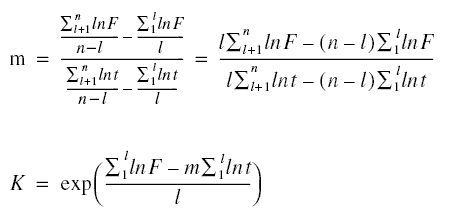
As noted in the previous equations, the summation sign is used. Although only two points are needed to determine the
constants, the actual experimentation may be conducted to produce several points. Since the equation only needs two
points, the data are then grouped into two groups. Thus, l is the number of experimental data in the first group in a
total of n experimental data points. The second group would consist of n - l data points. Equation given above may be
used to estimate the ultimate flux of a given membrane at the end of its life (one to two years).
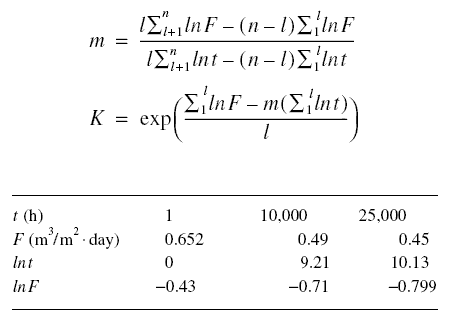
Example : A long term experiment for a CA membrane module operated at 2,757.89 kPag using a feed of 2,000 mg/L
of NaCl at 25 deg C produces the results below. What is the expected flux at the end of one year of operation ? What is the
expected flux at the end of two years ? How long does it take for the flux to decrease to
0.37 m3/m2.day ?

Solution :
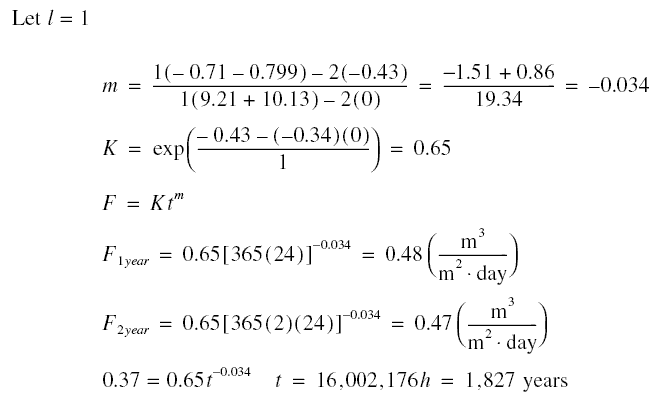
that is, if the membrane has not broken before this time !
Flux through membrane as a function of pressure drop : The flow of permeate through a membrane may be considered as a
“microscopic” form of cake filtration, where the solute that polarizes at the feed side of the membrane may be considered
as the cake. In cake filtration, the volume of filtrate that passes through the cake in time t can be solved from ;

where mu is the absolute viscosity of filtrate; c, the mass of cake per unit volume of filtrate collected; alpha the
specific cake resistance; -deltaP, the pressure drop across the cake and filter; S0, the filter area; and
Rm, the filter resistance. In RO, c is the solute collected on the membrane (in the concentration boundary
layer) per unit volume of permeate; and Rm, the resistance of the membrane. All the other parameters have
similar meanings as explained earlier. The volume flux F is ;

Using this and solving the above equation for ;


Initially neglecting the resistance of the solute in the concentration boundary layer,

in the denominator of the first factor on the right-side of the equation may be set to zero, producing

Now, considering the resistance of the solute, designate the combined effect of compressibility, membrane resistance
Rm, and solute resistance as alpham. Analogous to cake filtration, call alpham as
specific membrane resistance. Hence,
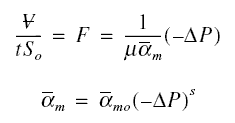
where s is an index of membrane and boundary layer compressibility. When s is equal to zero, alpham is equal
to alphamo, the constant of proportionality of the equation. Calling the pressure in the feed side as
Pf, the net pressure Pfn acting on the membrane in the feed side is

where pif is the osmotic pressure in the feed side. Also, calling the pressure in the permeate side as
Pp, the net pressure Ppn acting on the membrane in the permeate side is

where pip is the osmotic pressure in the permeate side. Thus,

and the flux F is

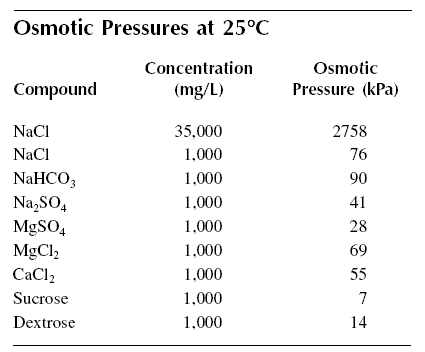
Table given below shows osmotic pressure values of various solutes. Some generalizations may be made from this table. For
example, comparing the osmotic pressures of 1,000 mg/L of NaCl and 1,000 mg/L of Na2SO4, the former
has about 1.8 times that of the osmotic pressure of the latter. In solution for the same masses, NaCl yields about 1.6
times more particles than Na2SO4. From this it may be concluded that osmotic pressure is a function
of the number of particles in solution. Comparing the 1,000 mg/L concentrations of Na2SO4 and
MgSO4, the osmotic pressure of the former is about to 1.4 times that of the latter. In solution
Na2SO4 yields about 1.3 more particles than MgSO4. The same conclusions will be drawn
if other comparisons are made; therefore, osmotic pressure depends on the number of particles in solution. From this
finding, osmotic pressure is, therefore, additive.
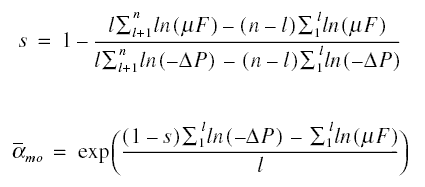
Determination of alphamo and s : The straight-line form of equation given just above is

This equation needs only two data points of ln(mu F) and ln(-delta P) to determine the constants alphamo and s.
Assuming there are a total of n experimental data points and using the first l data points for the first equation, the last
n - l data points for the second equation, and using the techniques of analytic geometry, the following equations are
produced :
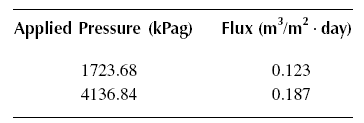
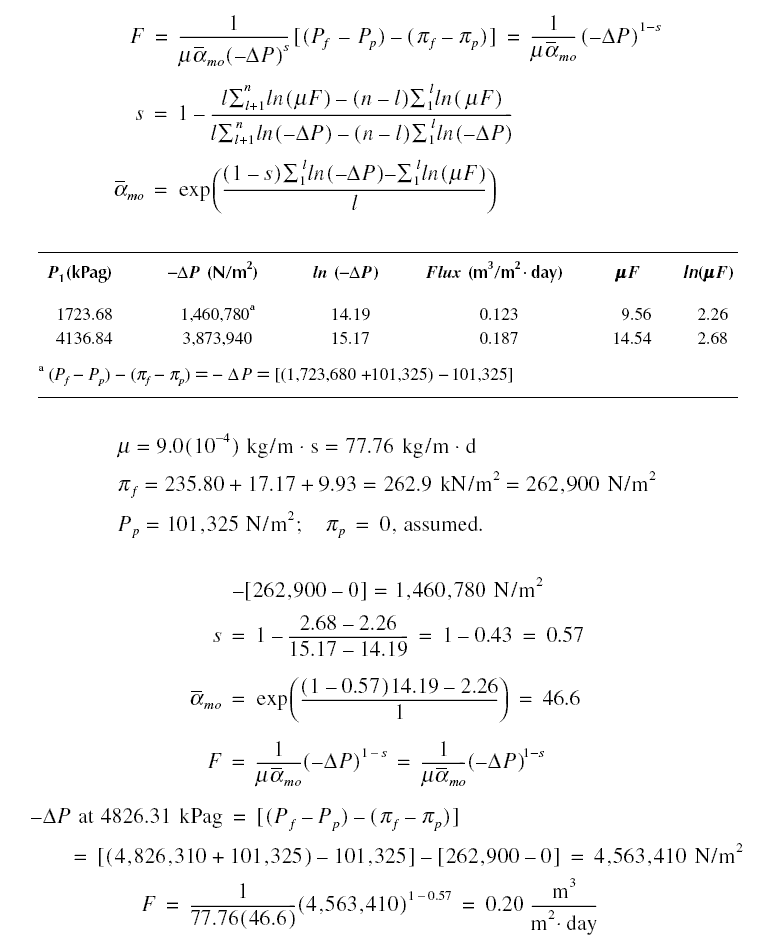
Example : The feedwater to an RO unit contains 3,000 mg/L of NaCl, 300 mg/L of CaCl2, and 400 mg/L of
MgSO4. The membrane used is cellulose acetate and the results of a certain study are shown below. What will
the flux be if the pressure applied is increased to 4,826.31 kPag ? Assume that for the given concentrations the osmotic
pressures are NaCl = 235.80 kPa, CaCl2 = 17.17 kPa, and MgSO4 = 9.93 kPa. Also, assume the
temperature during the experiment is 25 deg C.
Solution :
Effect of temperature on permeation rate : As shown in equation given above, the flux is a function of the dynamic
viscosity mu. Because mu is a function of temperature, the flux or permeation rate is therefore also a function of
temperature. As temperature increases, the viscosity of water decreases. Thus, from the equation, the flux is expected
to increase with increase in temperature. Correspondingly, it is also expected that the flux would decrease as the
temperature decreases. Figure shows the correction factor Cf for membrane surface area (for CA membranes) as
a function of temperature relative to 25 deg C. As shown, lower temperatures have larger correction factors. This is due
to the increase of mu as the temperature decreases. The opposite is true for the higher temperatures. These correction
factors are applied to the membrane surface area to produce the same flux relative to 25 deg C.
Percent solute rejection or removal : The other parameter important in the design and operation of RO units is the
percent rejection or removal of solutes. Let Qo be the feed inflow, [Co] be the feed concentration
of solutes, Qp be the permeate outflow, [Cp] be the permeate concentration of solutes, Qc
be the concentrate outflow, and [Cc] be the concentrate concentration of solutes. By mass balance of solutes,
the percent rejection R is

The index i refers to the solute species i. Figure shows the effect of operating time on percent rejection. As shown,
this particular membrane rejects divalent ions better than it does the monovalent ions. Generally, percent rejection
increases with the value of the ionic charge.
Example : A laboratory RO unit 152.4 cm in length and 30.48 cm in diameter has an active surface area of 102.18
m2. It is used to treat a feedwater with the following composition : NaCl = 3,000 mg/L, CaCl2 =
300 mg/L, and MgSO4 = 400 mg/L. The product flow is 0.61 m3/m2.day and contains 90
mg/L NaCl, 6 mg/L CaCl2, and 8 mg/L MgSO4. The feedwater inflow is 104.9 m3/day.
(a) What is the percent rejection of NaCl ? (b) What is the over-all percent rejection of ions ?
Solution :

Carbon Adsorption...
Solids are formed because of the attraction of the component atoms within the solid toward each other. In the interior of
a solid, attractive forces are balanced among the various atoms making up the lattice. At the surface, however, the atoms
are subjected to unbalanced forces—the ones toward the interior are attracted, but the ones at the surface are not.
Because of this unbalanced nature, any particle that lands on the surface may be attracted by the solid. This is the
phenomenon of adsorption, which is the process of concentrating solute at the surface of a solid by virtue of this
attraction. Adsorption may be physical or chemical. Physical adsorption is also called van der Waals adsorption, and
chemical adsorption is also called chemisorption. In the former, the attraction on the surface is weak, being brought
about by weak van der Waals forces. In the latter, the attraction is stronger as a result of some chemical bonding that
occurs. Adsorption is a surface-active phenomenon which means larger surface areas exposed to the solutes result in higher
adsorption. The solute is called the adsorbate; the solid that adsorbs the solute is called the adsorbent. The adsorbate
is said to be sorbed onto the adsorbent when it is adsorbed, and it is said to be desorbed when it passes into solution.
Adsorption capacity is enhanced by activating the surfaces. In the process using steam, activation is accomplished by
subjecting a prepared char of carbon material such as coal to an oxidizing steam at high temperatures resulting in the
water gas reaction : C + H2O = H2 + CO. The gases released leave behind in the char a very porous
structure. The high porosity that results from activation increases the area for adsorption. One gram of char can produce
about 1,000 m2 of adsorption area. After activation, the char is further processed into three types of finished
product : powdered form called powdered activated carbon (PAC), the granular form called granular activated carbon (GAC),
and activated carbon fiber (ACF). PAC is normally less than 200 mesh; GAC is normally greater than 0.1 mm in diameter. ACF
is a fibrous form of activated carbon. Figure given below shows a schematic of the transformation of raw carbon to
activated carbon, indicating the increase in surface area.
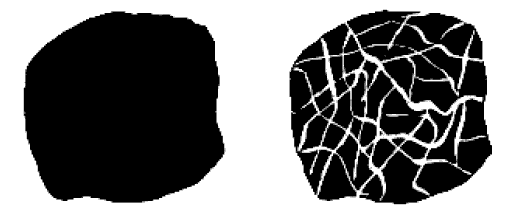
Raw carbon material on the left transforms to the carbon on the right after activation...
Activation Techniques...
Activation is the process of enhancing a particular characteristic. Carbon whose adsorption characteristic is enhanced
is called activated carbon. The activation techniques used in the manufacture of activated carbons are dependent on the
nature and type of raw material available. The activation techniques that are principally used by commercial production
operations are chemical activation and steam activation. As the name suggests, chemical activation uses chemicals in the
process and is generally used for the activation of peat-and wood-based raw materials. The raw material is impregnated
with a strong dehydrating agent, typically phosphoric pentoxide (P2O5) or zinc chloride
(ZnCl2) mixed into a paste and then heated to temperatures of 500–800 deg C to activate the carbon. The
resultant activated carbon is washed, dried, and ground to desired size. Activated carbons produced by chemical activation
generally exhibit a very open pore structure, ideal for the adsorption of large molecules. Steam activation is generally
used for the activation of coal and coconut shell raw materials. Activation is carried out at temperatures of 800–1,100
deg C in the presence of superheated steam. Gasification occurs as a result of the water–gas reaction :

This reaction is endothermic but the temperature is maintained by partial burning of the CO and H2 produced :

The activated carbon produced is graded, screened, and de-dusted. Activated carbons produced by steam activation generally
exhibit a fine pore structure, ideal for the adsorption of compounds from both the liquid and vapor phases.
Adsorption Capacity...
The adsorption capacity of activated carbon may be determined by the use of an adsorption isotherm. The adsorption
isotherm is an equation relating the amount of solute adsorbed onto the solid and the equilibrium concentration of
the solute in solution at a given temperature. The following are isotherms that have been developed : Freundlich ;
Langmuir ; and Brunauer, Emmet, and Teller (BET). The most commonly used isotherm for the application of activated
carbon in water and wastewater treatment are the Freundlich and Langmuir isotherms. The Freundlich isotherm is an
empirical equation ; the Langmuir isotherm has a rational basis as will be shown below. The respective isotherms are :
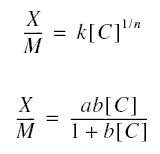
X is the mass of adsorbate adsorbed onto the mass of adsorbent M; [C] is the concentration of adsorbate in solution in
equilibrium with the adsorbate adsorbed ; n, k, a, and b are constants.
The Langmuir equation may be derived as follows. Imagine a particular experiment in which a quantity of carbon adsorbent
is added to a beaker of sample containing pollutant. Immediately, the solute will be sorbed onto the adsorbent until
equilibrium is reached. One factor determining the amount of the sorbed materials has to be the number of adsorption
sites in the carbon. The number of these sites may be quantified by the ratio X/M. By the nature of equilibrium processes,
some of the solutes adsorbed will be desorbed back into solution. While these solutes are desorbing, some solutes will also
be, again, adsorbed. This process continues on, like a seesaw; this “seesaw behavior” is a characteristic of systems in
equilibrium. The rate of adsorption rs is proportional to the concentration in solution, [C], (at equilibrium
in this case) and the amount of adsorption sites left vacant by the desorbing solutes. Now, let us determine these vacant
adsorption sites. On a given trial of the experiment, the number of adsorption sites filled by the solute may be quantified
by the ratio X/M, as mentioned previously. The greater the concentration of the solute in solution, the greater this ratio
will be. For a given type of solute and type of carbon adsorbent, there will be a characteristic one maximum value for
this ratio. Call this (X/M)ult. Now, we have two ratios: X/M, which is the ratio at any time and
(X/M)ult, which is the greatest possible ratio. The difference of these two ratios is proportional to the
number of adsorption sites left vacant; consequently, the rate of adsorption rs is therefore equal to
ks[C][(X/M)ult - (X/M)], where ks is a proportionality constant.
For the desorption process, as the ratio (X/M) forms on the adsorbent, it must become a driving force for desorption.
Thus, letting kd be the desorption proportionality constant, rd = (kd)(X/M), where
rd is the rate of desorption. The process is in equilibrium, so the rate of adsorption is equal to the rate
of desorption. Therefore,

Solving for X/M produces equation given above, where a = (X/M)ult and b = ks/kd. Note
that in the derivation no mention is made of how many layers of molecules are sorbed onto or desorbed from the activated
carbon. It is simply that solutes are sorbed and desorbed, irrespective of the counts of the layers of molecules; however,
it is conceivable that as the molecules are deposited and removed, the process occurs layer by layer. The straight-line
forms of the Freundlich and Langmuir isotherms are, respectively,
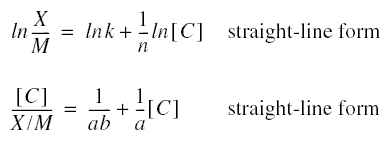
Because the equations are for straight lines, only two pairs of values of the respective parameters are required to solve
the constants. For the Freundlich isotherm, the required pairs of values are the parameters ln(X/M) and ln[C]; for the
Langmuir isotherm, the required pairs are the parameters [C]/(X/M) and [C].
To use the isotherms, constants are empirically determined by running an experiment. This is done by adding increasing
amounts of the adsorbent to a sample of adsorbate solution in a container. For each amount of adsorbent added,
Mi, the equilibrium concentration [Ci] is determined. The pairs of experiment trial values can then
be used to obtain the desired parameter values from which the constants are determined. Once the constants are determined,
the resulting model is used to determine M, the amount of adsorbent (activated carbon) that is needed. From the derivation,
the adsorption capacity of activated carbon is a = (X/M)ult. From this ratio, the absorption capacity of
activated carbon is shown as the maximum value of the X/M ratios. This ratio corresponds to a concentration equal to the
maximum possible solute equilibrium concentration. The value of X is obtained as follows: Let [Co] be the
concentration of solute in a sample of volume before adsorption onto a mass of adsorbent M. Then

Determination of the Freundlich Constants...
Using the techniques of analytic geometry, let us derive the Freundlich constants in a little more detail than used in the
derivation of the constants in the discussion of reverse osmosis treated previously. As mentioned, the straight-line form
of the equation requires only two experimental data points; however, experiments are normally conducted to produce not just
two pair of values but more. Thus, the experimental results must be reduced to just the two pairs of values required for
the determination of the parameters; therefore, assuming there are m pairs of values, these m pairs must be reduced to
just two pairs. Once the reduction to two pairs has been done, the isotherm equation may be then be written to just the
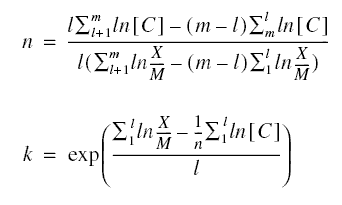
two pairs of derived values as follows :

The index l is the number of data points for the first group. These equations may then be solved for n and k producing
Determination of the Langmuir Constants...
As was done with the Freundlich constants, the Langmuir equation may be manipulated in order to solve the Langmuir
constants. From the m pairs of experimental data
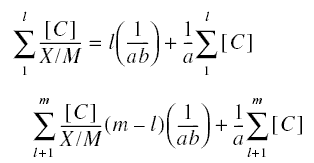
Solving for the constants a and b produces
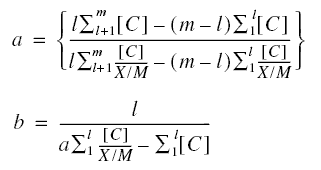
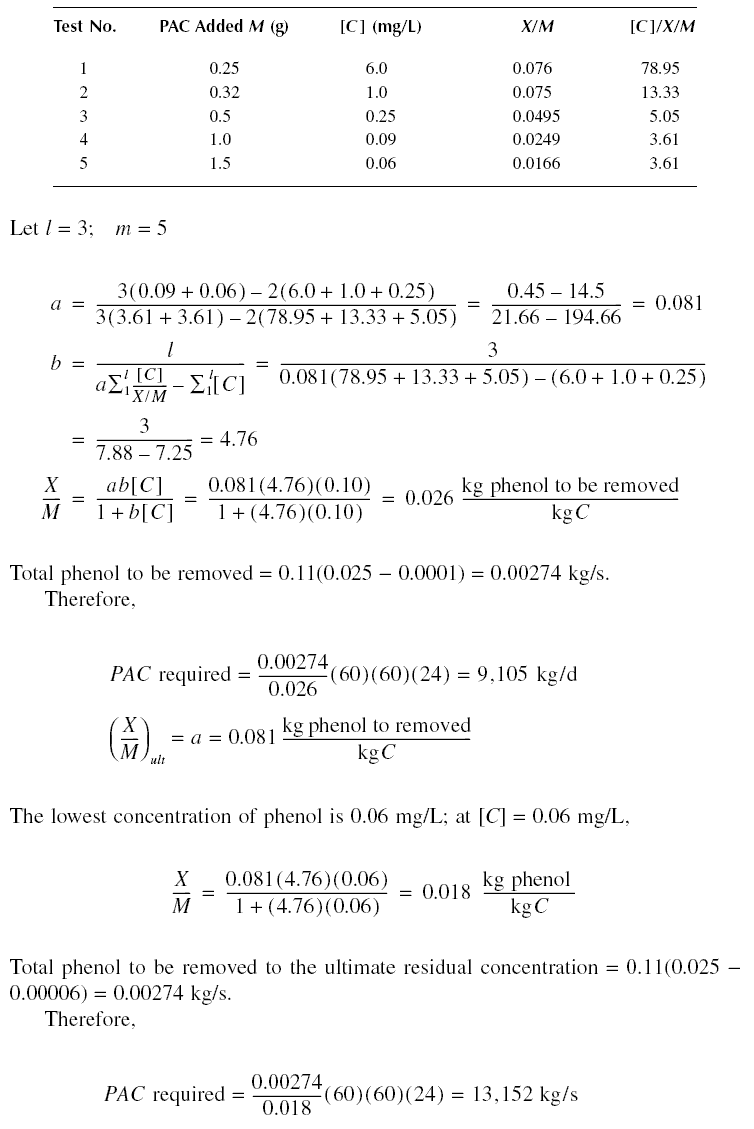
Example : A wastewater containing [Co] = 25 mg/L of phenol is to be treated using PAC to produce an
effluent concentration [C]eff = of 0.10 mg/L. The PAC is simply added to the stream and the mixture subsequently
settled in the following sedimentation tank. The constants of the Langmuir equation are determined by running a jar test
producing the results below. The volume of waste subjected to each test is one liter. If a flow rate of Qo of
0.11 m3/s is to be treated, calculate the quantity of PAC needed for the operation. What is the adsorption
capacity of the PAC ? Calculate the quantity of PAC needed to treat the influent phenol to the ultimate residual
concentration.
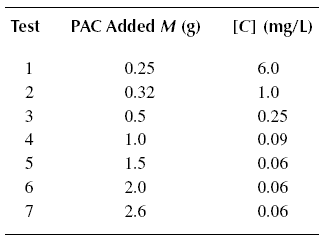
Solution :
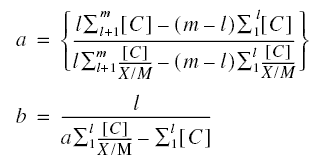
Neglect tests 6 and 7, because the additional values of 0.06’s would not conform to the Langmuir equation.
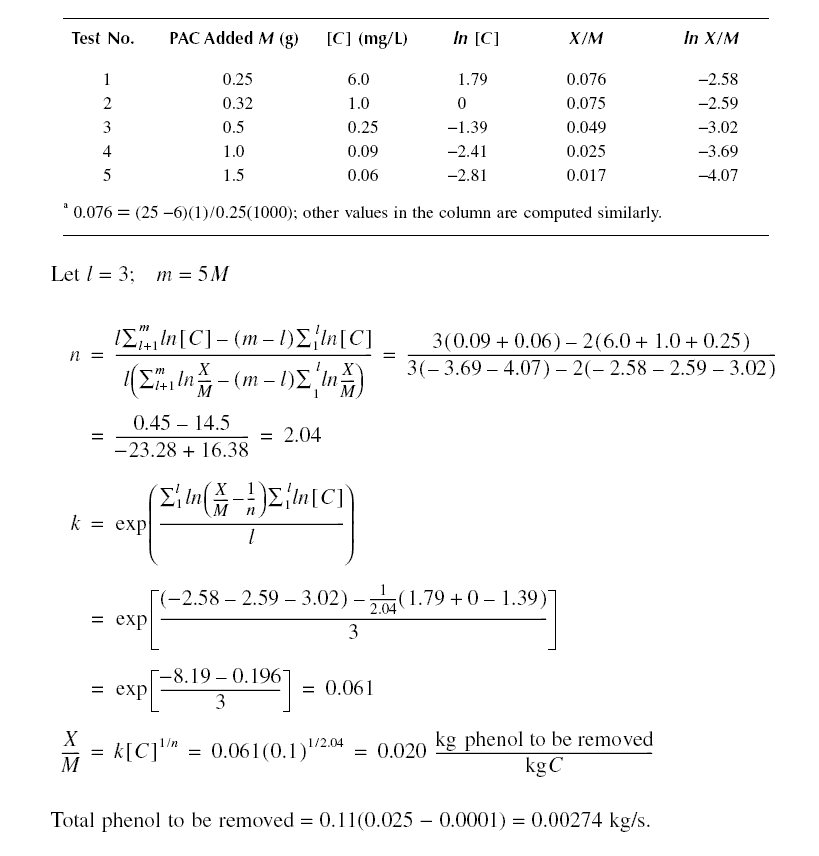
Example : Solve the previous example using the Freundlich isotherm.
Solution :
Neglect tests 6 and 7, because the additional values of 0.06’s would not conform to the Langmuir equation.

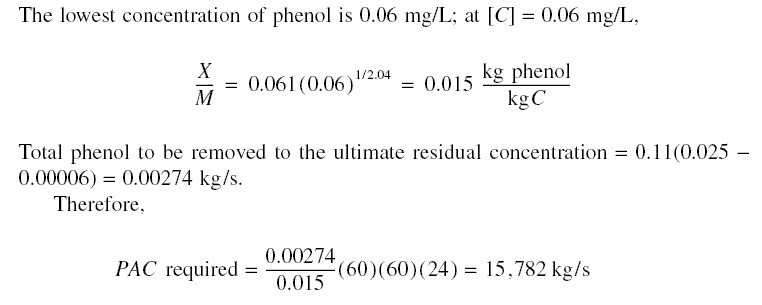
From X/M = k[C]1/n, as [C] increases, X/M increases, such that, theoretically, X/M could become infinite.
Practically, this means that equilibrium concentrations of C must be determined experimentally until found. The data do
not reflect this. Therefore, the adsorption capacity would have to be solved using the Langmuir isotherm; thus,

Bed Adsorption and Active Zone...
In bed adsorption, the water to be treated is passed through a bed of activated carbon, in which the form of carbon is
normally GAC. The method of introduction of the influent may be made similar to sand filtration. In addition, the bed may
be moving countercurrent or co-current to the flow of influent. Figure located below shows a cutaway view of a carbon-bed
adsorption unit. By a suitable modification of valve arrangements, this unit may be operated countercurrently or
co-currently, in addition to being operated with the carbon bed stationary—the mode of operation depicted in the figure.
Figure given below shows a schematic of an adsorption bed of depth L. Although the influent feed shown is introduced at
the top, the following analysis applies to other modes of introduction as well, including moving beds. Hence, the figure
should be viewed as a relative motion of the feed and the bed. The curved lines represent the configuration of the
variation of the concentration of the adsorbate at various times as the adsorbate passes through the column. Thus, the
curve labeled t1 is the configuration at time t1. The lower end of the curve is indicated by a zero
concentration (or any concentration that represents the limit of removal) and the upper end is indicated by the influent
concentration [Co]. Thus, the volume of bed above curve t1 is an exhausted bed. Below the curve, the
bed is clean (i.e., no adsorption is taking place, because all adsorbables had already been removed by the portion of the
bed at curve t1 and above). The zone of bed encompassed by the curve represents a bed partially exhausted. The
curve t1 then advances to form the curve t2 at time t2. The curve shows a breakthrough of
concentration of some fraction of [Co]. This breakthrough concentration appears in the effluent. Finally
t2 advances to t3 at time t3. At this time, the bed is almost exhausted. The profile
concentration represented by curve t1 is called an active zone. This zone keeps on advancing until the whole
bed becomes totally exhausted.
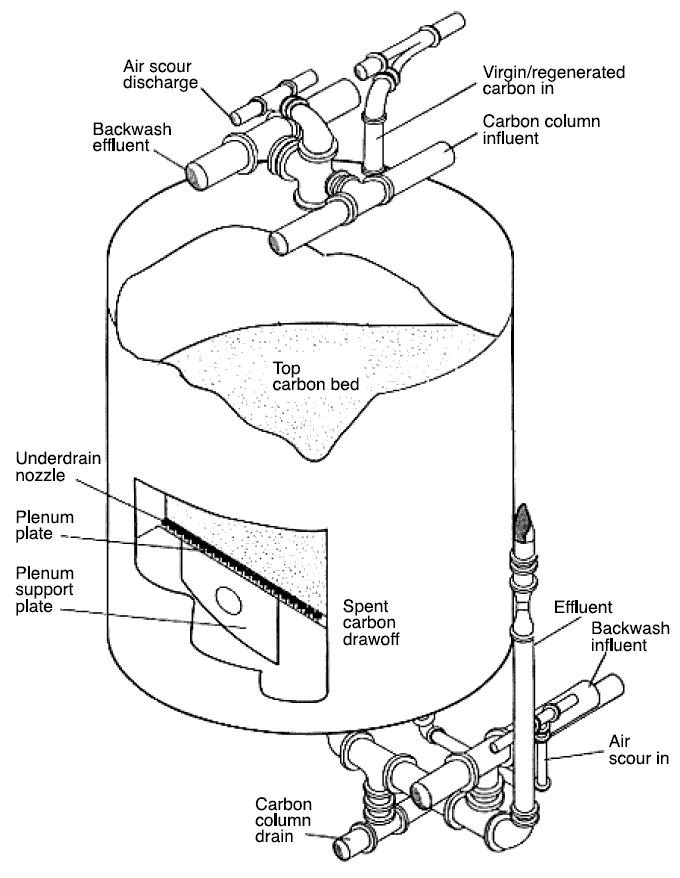
A bed carbon adsorption unit...
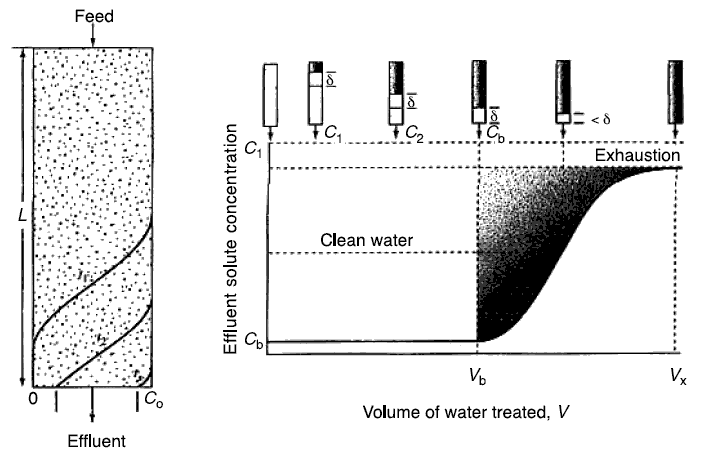
Active zones at various times during adsorption and the breakthrough curve...
It is to be noted that by the nature of the process, the concentration at the bottom of the active zone as it moves through
the column has to be at the limiting residual concentration. Thus, as long as sigma has not reached the bottom of the
column, the effluent is the limiting residual concentration that a particular batch of carbon is capable of removing.
Figure located above shows the movement of the active zone represented by the length sigma as it advances through the
bed at various times. At the beginning of breakthrough, at which the lower end of sigma barely touches the bottom of the
column, the total volume of treated water is represented by Vb. The shaded portion in the curve represents the
total breakthrough mass of adsorbate before exhaustion. The total volume of wastewater treated at exhaustion is designated
by Vx.
Determination of the length of the active zone : The length of the active zone represents a portion of bed that is
no longer totally usable, since this is the particular length when breakthrough occurs. It is therefore important that this
length be allowed for in design. To determine this length, perform a mass balance on the active zone during breakthrough.
The total mass of pollutant that escaped removal from the beginning to the completion of breakthrough is

where the indices n and n + 1 refer to the volume or concentration that broke through sigma at a time step of delta t
from tn to tn+1. Also, at the completion of breakthrough, the total mass of pollutant introduced
into the influent of sigma is :

Thus, the mass of pollutants retained in the active zone Mr is :

Mr is also equal to :

where As is the superficial area of the
bed, rop is the packed density of the carbon bed, and the others are as defined before. Combining with the
previous equation and solving for sigma,

To use this equation for the determination of the active zone length, in practice, a breakthrough experiment is conducted.
Breakthrough volumes and concentrations as depicted in figure are recorded. From the data, sigma may be calculated using
the previous equation. It is important that the rate of application of the influent be recorded, as the length of sigma
is dependent upon this flow rate. The faster the rate of application, the longer the length of sigma, and the slower the
rate of application, the shorter the length of sigma.
Example : A breakthrough experiment is conducted for phenol producing the results in the following table. Determine
the length sigma of the active zone. The diameter of the column used is 2.54 cm, and the packed density of the bed is
721.58 kg/m3. [Co] is equal to 25 mg/L. X/M = 0.020 kg/kg.
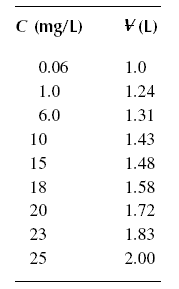
Solution :

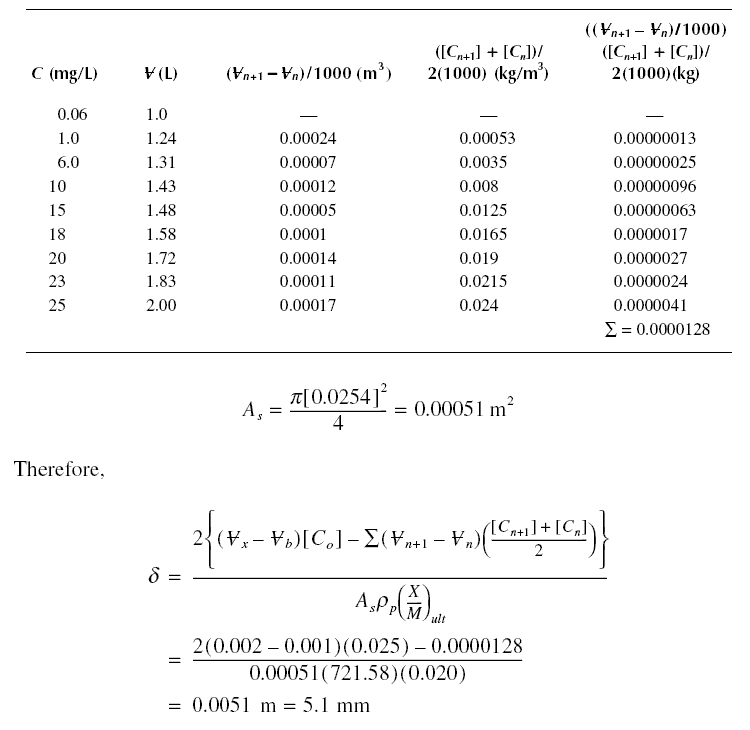
Example : A wastewater containing 25 mg/L of phenol and having the characteristic breakthrough of the previous
example is to be treated by adsorption onto an activated carbon bed. The flow rate during the breakthrough experiment is
0.11 m3/s; this is equivalent to a surficial velocity of 0.0088 m/s. The X/M ratio of the bed for the desired
effluent of 0.06 mg/L is 0.02 kg solute per kg carbon. If the flow rate for design is also 0.11 m3/s, design
the absorption column. Assume the influent is introduced at the top of the bed. The packed density of the carbon bed is
721.58 kg/m3.
Solution : The design will include the determination of the amount of activated carbon needed, the dimensions of
the column, and the interval of activated carbon replacement.
Amount of phenol to be removed = 0.11(0.025 - 0.00006)(60)(60)(24) = 237 kg/d
Amount of activated carbon needed = 237/0.02 = 11,850 kg/d
From the previous example, adsorbate retained in sigma length of test column at
exhaustion = 2(0.002 - 0.001)(0.025) - 0.0000128 = 0.000037 kg. For As of the test column = 0.00051 m and
sigma = 0.0051 m, adsorbate retained per unit volume in sigma = 14.23 kg.
Assume diameter of actual column 4 m; As = pi (42)/4 = 12.57 m2. Using 2 columns, adsorbate retained
in sigma length of the columns = 2(12.57)(0.0051)(14.23) = 1.82 kg. Assuming carbon replacement is to be done every week,
adsorbate retained in column length of length L - sigma = 237(7) - 1.82 = 1,657 kg. Carbon required for the 1,657 kg of
adsorbate = 1,657 / 0.02 = 82,850 kg = 41,425 kg/column. Therefore,

Diameter = 4 m. Interval of carbon replacement = once every week. As soon as the bed is exhausted, as determined by the
breakthrough of concentrations, the carbon may be replaced. The replaced carbon may be reactivated again for reuse. Up to
30 or more reactivations may be made without appreciable loss of adsorptive power of the reactivated carbon.
Relative Velocities in Bed Adsorption...
As mentioned before, the unit operation of bed adsorption may be carried out in a moving-bed mode, either co-currently or
countercurrently. When the breakthrough experiment is carried out, the superficial velocity should also be recorded. The
reason is that adsorption is a function of the time of contact between the liquid phase containing the solute to be
adsorbed and solid-phase carbon bed. Thus, for the breakthrough data to be applicable to an actual prototype adsorption
column, the relative velocities that transpired during the test must be maintained in the actual column. When the relative
velocities between the flowing water and the carbon bed are maintained, it is immaterial whether or not the bed is moving.
Consider first the co-current operation. Let Vs be the superficial velocity of the flowing water relative to the
stationary earth and Vb be the velocity of the bed also relative to the stationary earth. Thus, the relative
velocity of the flowing water Vs/b relative to the bed is

For the countercurrent operation, the formula is

In a breakthrough experiment, the superficial velocity may be obtained by dividing the volume of water collected in t time
by the superficial area of the experimental column. Breakthrough experiments are invariably conducted in stationary beds.
Thus, from the previous equations this superficial velocity is actually the relative velocity of the flowing water with
respect to the bed, with Vb equal to zero. This relative velocity must be maintained in the actual column
design, if the data collected in the breakthrough experiment are to be applicable.
Example : Design the column of the previous example if the feed is introduced at the bottom. The carbon is
continuously removed at the bottom and continuously added at the top. Due to the countercurrent operation, assume the
bed expands by 40 %.
Solution : The design will include, in addition to those in the previous example, the determination of the carbon
removal and addition rates at the bottom and top of column, respectively. These rates are determined from the length of
the packed carbon in the column and the interval of replacement as stated in the previous example.

The superficial velocity, from the previous example = 0.0088 m/s, velocity relative to the stationary bed. In the
countercurrent operation, this relative velocity must be maintained if the breakthrough curve is to be applicable.
Because of the expansion, Vb is increased by 40 %. Thus, Vs in present design considering the
expansion :


Head Losses in Bed Adsorption...
The operation of carbon bed adsorption units is similar to that of filtration units. In fact, bed adsorption is partly
filtration. Countercurrent flow operation is analogous to filter backwashing, and co-current flow operation is analogous
to normal down-flow or gravity filtration. Head loss calculations for bed adsorption are therefore the same as those with
filtration. Since head loss formulas through beds of solids have already been discussed under filtration, they will not be
pursued here. The important point to remember is that for filtration formulas to apply under moving-bed adsorption
operations, the superficial velocity should now be considered relative velocity.
Problems...
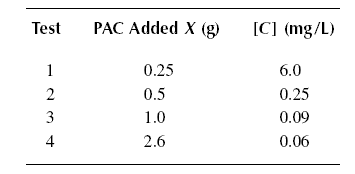
( 01 ) A wastewater containing a [Co] = 25 mg/L of phenol is to be treated using PAC to produce an effluent
concentration [C]eff = 0.10 mg/L. The PAC is simply added to the stream and the mixture subsequently
settled in the following sedimentation tank. The constants of the Langmuir equation are determined by running a jar
test producing the results below. The volume of waste subjected to each test is one liter. If the flow rate Qo
is 0.11 m3/s, calculate the quantity of PAC needed for the operation. What is the adsorption capacity of the
PAC ? Calculate the quantity of PAC needed to treat the influent phenol to the ultimate residual concentration. Use the
Langmuir isotherm.
( 02 ) Solve Problem ( 01 ) using the Freundlich isotherm.
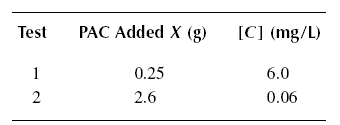
( 03 ) A wastewater containing a [Co] = 25 mg/L of phenol is to be treated using PAC to produce an effluent
concentration [C]eff = 0.10 mg/L. The PAC is simply added to the stream and the mixture subsequently settled
in the following sedimentation tank. The constants of the Langmuir equation is determined by running a jar test producing
the results below. The volume of waste subjected to each test is one liter. If the flow rate Qo is
0.11 m3/s, calculate the quantity of PAC needed for the operation. What is the adsorption capacity of the PAC ?
Calculate the quantity of PAC needed to treat the influent phenol to the ultimate residual concentration. Use the Langmuir
isotherm.
( 04 ) Solve Problem ( 03 ) using the Freundlich isotherm.
( 05 ) A wastewater containing a [Co] = 25 mg/L of phenol is to be treated using PAC to produce an effluent
concentration [C]eff = 0.10 mg/L. The PAC is simply added to the stream and the mixture subsequently
settled in the following sedimentation tank. The constants of the Langmuir equation are determined by running a
jar test producing the results below. The volume of waste subjected to each test is one liter. If the flow rate
Qo is 0.11 m3/s, calculate the quantity of PAC needed for the operation. What is the adsorption
capacity of the PAC ? Calculate the quantity of PAC needed to treat the influent phenol to the ultimate residual
concentration. Use the Langmuir isotherm.

( 06 ) Solve Problem ( 05 ) using the Freundlich isotherm.
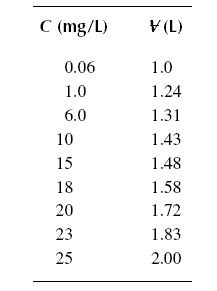
( 07 ) A breakthrough experiment is conducted for phenol producing the results below. The length of the active zone is
calculated to be 5.1 mm. The diameter of the column used is 2.5 cm, and the packed density of the bed is
721.58 kg/m3 (X/M)ult = 0.020 kg/kg. Calculate the influent phenol concentration.
( 08 ) A breakthrough experiment is conducted for phenol producing the results shown in Problem ( 07 ). The length of the
active zone is calculated to be 5.1 mm. The influent phenol concentration is 25 mg/L. The packed density of the bed is
721.58 kg/m3 (X/M)ult = 0.020 kg/kg. Calculate the diameter of the column used in the experiment.
( 09 ) A breakthrough experiment is conducted for phenol producing the results shown in Problem ( 07 ). The length of the
active zone is calculated to be 5.1 mm. The influent phenol concentration is 25 mg/L. (X/M)ult = 0.020 kg/kg.
The diameter of the column used in the experiment is 2.5 cm. Calculate the packed density of the carbon used.
( 10 ) A breakthrough experiment is conducted for phenol producing the results shown in Problem ( 07 ). The length of
the active zone is calculated to be 5.1 mm. The influent phenol concentration is 25 mg/L. The diameter of the column
used in the experiment is 2.5 cm and the packed density of the bed is 721.58 kg/m3. Calculate the adsorption
capacity of the bed.
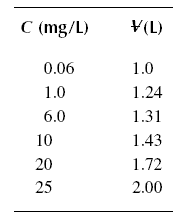
( 11 ) A breakthrough experiment is conducted for phenol producing the results below. Determine the length sigma of the
active zone. The diameter of the column used is 2.5 cm, and the packed density of the bed is 721.58 kg/m3.
[Co] is equal to 25 mg/L. (X/M)ult = 0.020 kg/kg.
( 12 ) A breakthrough experiment is conducted for phenol producing the results below. Determine the length sigma of the
active zone. The diameter of the column used is 2.5 cm, and the packed density of the bed is 721.58 kg/m3.
[Co] is equal to 25 mg/L. (X/M)ult = 0.020 kg/kg.
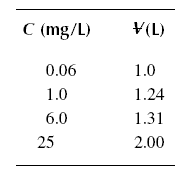
( 13 ) A breakthrough experiment is conducted for phenol producing the results below. Determine the length sigma of the
active zone. The diameter of the column used is 2.5 cm, and the packed density of the bed is 721.58 kg/m3.
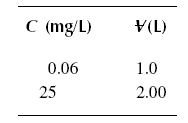
[Co] is equal to 25 mg/L. (X/M)ult = 0.020 kg/kg.
( 14 ) A wastewater containing 25 mg/L of phenol and having the characteristic breakthrough of Problem ( 11 ) is to be
treated by adsorption onto an activated carbon bed. Assume that the flow rate during the breakthrough experiment is
0.11 m3/s. The X/M ratio of the bed for the desired effluent of 0.1 mg/L is 0.029 kg solute per kg carbon.
If the flow rate for design is also 0.11 m3/s, design the absorption column. Assume the influent is introduced
at the top of the bed. The packed density of the carbon bed is 721.58 kg/m3.
( 15 ) A wastewater containing 25 mg/L of phenol and having the characteristic breakthrough of Problem ( 12 ) is to be
treated by adsorption onto an activated carbon bed. Assume that the flow rate during the breakthrough experiment is
0.11 m3/s. The X/M ratio of the bed for the desired effluent of 0.1 mg/L is 0.029 kg solute per kg carbon.
If the flow rate for design is also 0.11 m3/s, design the absorption column. Assume the influent is introduced
at the top of the bed. The packed density of the carbon bed is 721.58 kg/m3.
( 16 ) A wastewater containing 25 mg/L of phenol and having the characteristic breakthrough of Problem ( 13 ) is to be
treated by adsorption onto an activated carbon bed. Assume that the flow rate during the breakthrough experiment is
0.11 m3/s. The X/M ratio of the bed for the desired effluent of 0.1 mg/L is 0.029 kg solute per kg carbon.
If the flow rate for design is also 0.11 m3/s, design the absorption column. Assume the influent is introduced
at the top of the bed. The packed density of the carbon bed is 721.58 kg/m3.
( 17 ) A wastewater containing 25 mg/L of phenol and having the characteristic breakthrough of Problem ( 12 ) is to be
treated by adsorption onto an activated carbon bed. Assume that the flow rate during the breakthrough experiment is
0.11 m3/s. The X/M ratio of the bed for the desired effluent of 0.1 mg/L is 0.020 kg/kg. If the flow rate for
design is also 0.11 m3/s, design the absorption column. Assume the influent is introduced at the top of the
bed. The packed density of the carbon bed is 721.58 kg/m3.
( 18 ) A wastewater containing 25 mg/L of phenol and having the characteristic breakthrough of Problem ( 13 ) is to be
treated by adsorption onto an activated carbon bed. Assume that the flow rate during the breakthrough experiment is
0.11 m3/s. The X/M ratio of the bed for the desired effluent of 0.1 mg/L is 0.020 kg/kg. If the flow rate for
design is also 0.11 m3/s, design the absorption column. Assume the influent is introduced at the top of the
bed. The packed density of the carbon bed is 721.58 kg/m3.
( 19 ) Design the column of Problem ( 14 ) if the feed is introduced at the bottom. The carbon is continuously removed at
the bottom and continuously added at the top. Due to the countercurrent operation, assume the bed expands by 40 %.
( 20 ) Design the column of Problem ( 15 ) if the feed is introduced at the bottom. The carbon is continuously removed at
the bottom and continuously added at the top. Due to the countercurrent operation, assume the bed expands by 40 %.
( 21 ) Design the column of Problem ( 16 ) if the feed is introduced at the bottom. The carbon is continuously removed at
the bottom and continuously added at the top. Due to the countercurrent operation, assume the bed expands by 40 %.
( 22 ) Design the column of Problem ( 17 ) if the feed is introduced at the bottom. The carbon is continuously removed at
the bottom and continuously added at the top. Due to the countercurrent operation, assume the bed expands by 40 %.
( 23 ) Design the column of Problem ( 18 ) if the feed is introduced at the bottom. The carbon is continuously removed at
the bottom and continuously added at the top. Due to the countercurrent operation, assume the bed expands by 40 %.
( 24 ) A brackish water of 379 m3/day containing 4,000 mg/L of ions expressed as NaCl is to be deionized using
an electrodialysis unit. The coulomb efficiency is 0.78 and there are 400 membranes in the unit each measuring
51 cm × 46 cm. Resistance across the unit is 6 ohms and the current efficiency is 90 %. Estimate the power requirement.
( 25 ) A brackish water of 379 m3/day is to be deionized using an electrodialysis unit. The coulomb efficiency
is 0.78, and 400 membranes are in the unit each measuring 51 cm × 46 cm. Resistance across the unit is 6 ohms and the
current efficiency is 90 %. The input power required to run the unit is 93.3 kW. Estimate the concentration of ions to be
removed expressed as NaCl.
( 26 ) A brackish water containing 4,000 mg/L of ions expressed as NaCl is to be deionized using an electrodialysis unit.
The coulomb efficiency is 0.78, and 400 membranes are in the unit each measuring 51 cm × 46 cm. Resistance across the unit
is 6 ohms and the current efficiency is 90 %. The input power required to run the unit is 93.3 kW. Estimate the input flow
to the unit.
( 27 ) A brackish water containing 4,000 mg/L of ions expressed as NaCl is to be deionized using an electrodialysis unit.
There are 400 membranes in the unit each measuring 51 cm × 46 cm. Resistance across the unit is 6 ohms and the current
efficiency is 90 %. The input power required to run the unit is 93.3 kW. If the inflow to the unit is 379 m3/day,
calculate the coulomb efficiency.
( 28 ) A brackish water containing 4,000 mg/L of ions expressed as NaCl is to be deionized using an electrodialysis unit.
Resistance across the unit is 6 ohms and the current efficiency is 90 %. The input power required to run the unit is 93.3
kW. If the inflow to the unit is 379 m3/day and the coulomb efficiency is 0.78, estimate the number of membranes
in the unit.
( 29 ) A brackish water containing 4,000 mg/L of ions expressed as NaCl is to be deionized using an electrodialysis unit.
Resistance across the unit is 6 ohms. The input power required to run the unit is 93.3 kW. The inflow to the unit is
379 m3/day, the coulomb efficiency is 0.78, and 400 membranes are in the unit each measuring 51 cm × 46 cm.
Calculate the current efficiency.
( 30 ) A brackish water containing 4,000 mg/L of ions expressed as NaCl is to be deionized using an electrodialysis unit.
The input power required to run the unit is 93.3 kW. The inflow to the unit is 379 m3/day, the coulomb
efficiency is 0.78, and 400 membranes are in the unit each measuring 51 cm × 46 cm. The current efficiency is 90 %. What
is the electric resistance across the unit ?
( 31 ) A brackish water of 379 m3/day containing 4,000 mg/L of ions expressed as NaCl is to be deionized using
an electrodialysis unit. There are 400 membranes in the unit each measuring 51 cm × 46 cm inches. Resistance across the
unit is 6 ohms, the current and coulomb efficiencies are, respectively, 90 % and 78 %. Estimate the impressed current.
( 32 ) A brackish water of 379 m3/day is to be deionized using an electrodialysis unit. There are 400 membranes
in the unit each measuring 51 cm × 46 cm inches. Resistance across the unit is 6 ohms, the current and coulomb efficiencies
are, respectively, 90 % and 78 %. If the impressed current is 124.76 amperes, what is the concentration of the ions in the
raw water expressed as NaCl ?
( 33 ) A brackish water containing 4,000 mg/L of ions expressed as NaCl is to be deionized using an electrodialysis unit.
There are 400 membranes in the unit each measuring 51 cm × 46 cm inches. Resistance across the unit is 6 ohms, the current
and coulomb efficiencies are, respectively, 90 % and 78 %. If the impressed current is 124.76 amperes, what is the influent
flow to the unit ?
( 34 ) A brackish water containing 4,000 mg/L of ions expressed as NaCl is to be deionized using an electrodialysis unit.
There are 400 membranes in the unit each measuring 51 cm × 46 cm inches. Resistance across the unit is 6 ohms; the current
efficiency is 90 %. If the impressed current is 124.76 amperes and the influent flow to the unit is 379 m3/day,
what is the coulomb efficiency ?
( 35 ) A brackish water containing 4,000 mg/L of ions expressed as NaCl is to be deionized using an electrodialysis unit.
Resistance across the unit is 6 ohms, the current and coulomb efficiencies are, respectively, 90 % and 78 %. If the
impressed current is 124.76 amperes and the influent flow to the unit is 379 m3/day, calculate the number of
membranes in the unit.
( 36 ) A brackish water containing 4,000 mg/L of ions expressed as NaCl is to be deionized using an electrodialysis unit.
Resistance across the unit is 6 ohms; the coulomb efficiency is 78 %. If the impressed current is 124.76 amperes and the
influent flow to the unit is 379 m3/day, calculate the current efficiency.
( 37 ) A long term experiment for a CA membrane module operated at 2,758 kPag using a feed of 2,000 mg/L of NaCl at
25 deg C produces the results below. What is the expected flux at the end of one year of operation ? What is the expected
flux at the end of two years ? How long does it take for the flux to decrease to 0.37 m3/m2.day ?

( 38 ) The feedwater to an RO unit contains 3,000 mg/L of NaCl, 300 mg/L of CaCl2, and 400 mg/L of
MgSO4. The membrane used is cellulose acetate. Applying a pressure of 4,826 kPag, the flux is found to be
0.203 m3/m2.day. If s and alphamo are, respectively, 0.5597 and 54.72 in the MKS system
of units (meter-kilogram-second), at what temperature is the unit being operated ?
( 39 ) The feedwater to an RO unit contains 3,000 mg/L of NaCl, 300 mg/L of CaCl2, and 400 mg/L of
MgSO4. The membrane used is cellulose acetate. Applying a pressure of 4,826 kPag, the flux is found to be
0.203 m3/m2.day. If s is equal to 0.5597 in the MKS system of units (meter-kilogram-second) and the
temperature of operation is 25 deg C, what is the value of alphamo ?
( 40 ) The feedwater to an RO unit contains 3,000 mg/L of NaCl, 300 mg/L of CaCl2, and 400 mg/L of
MgSO4. The membrane used is cellulose acetate. The flux is 0.203 m3/m2.day. If s and
alphamo are, respectively, 0.5597 and 54.72 in the MKS system of units (meter-kilogram-second) and the
temperature is 25 deg C, what is the pressure applied to the membrane ?
( 41 ) The feedwater to an RO unit contains 3,000 mg/L of NaCl, 300 mg/L of CaCl2, and 400 mg/L of
MgSO4. The membrane used is cellulose acetate. Applying a pressure of 4,826 kPag, the flux is found to be
0.203 m3/m2.day. If alphamo is 54.72 in the MKS system of units (meter-kilogram-second)
and the temperature is 25 deg C, what is the value of s?
Source : "A. P. Sincero and G. A. Sincero, 2003..."


