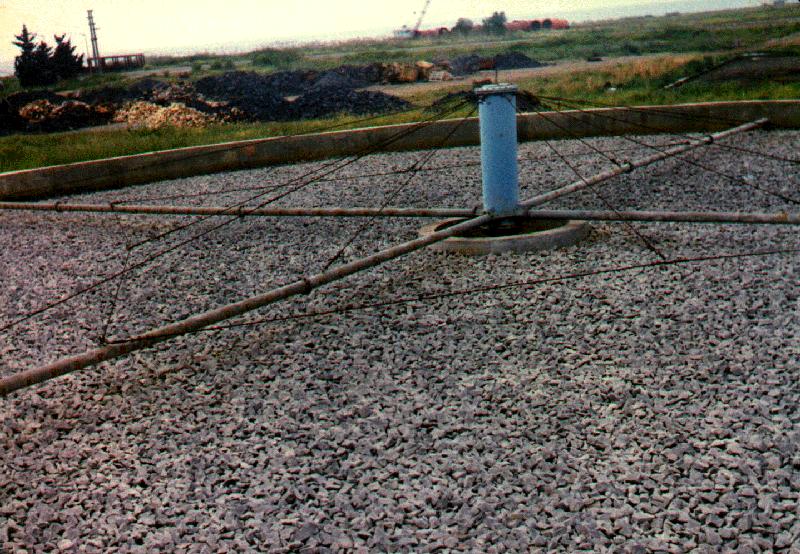
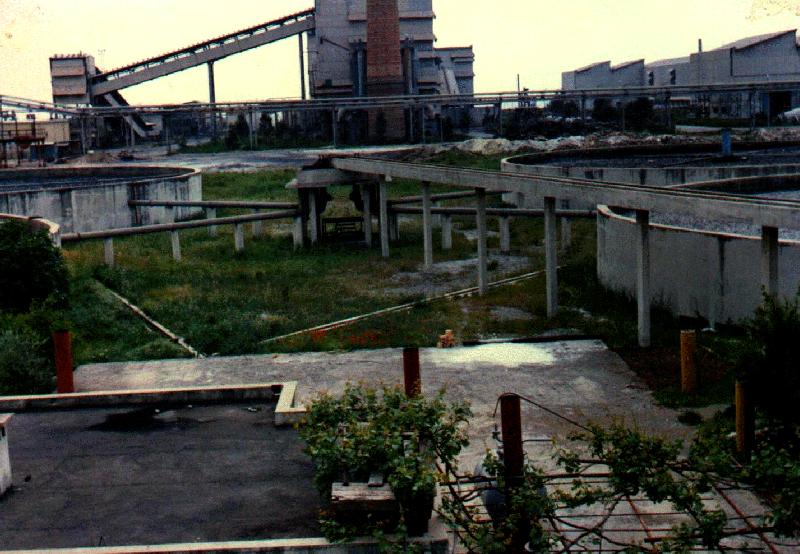
Trickling Filter - 6...
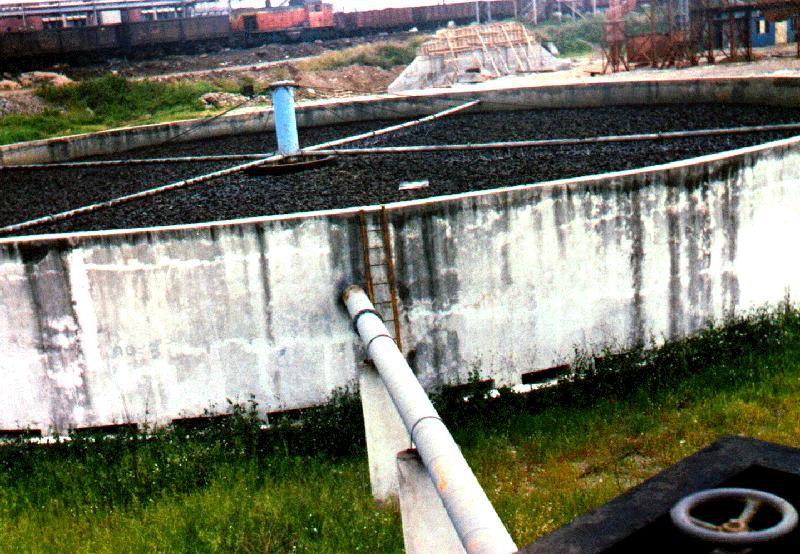
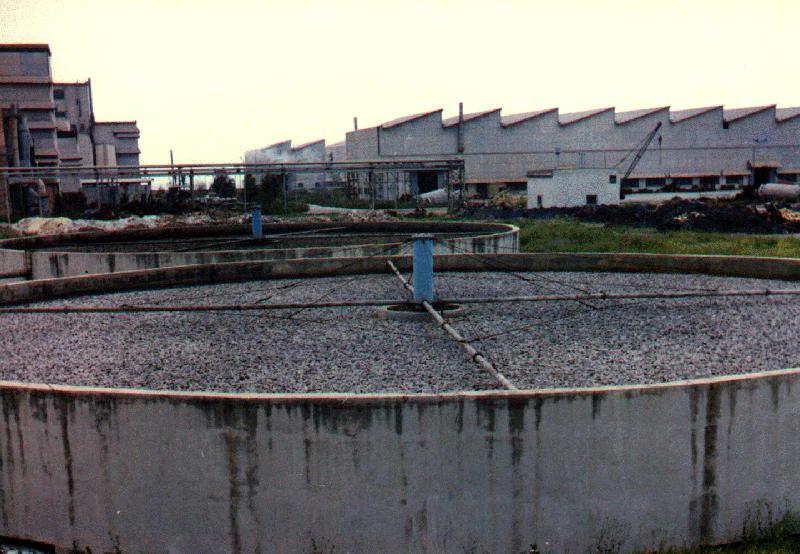
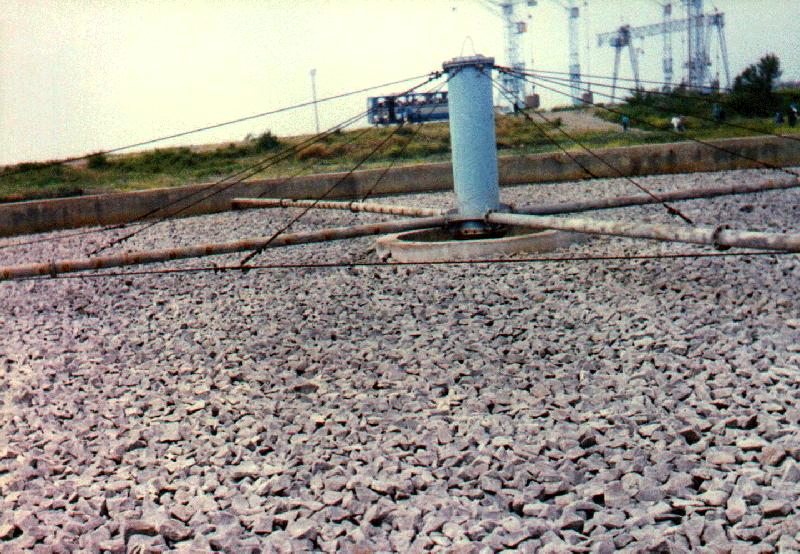
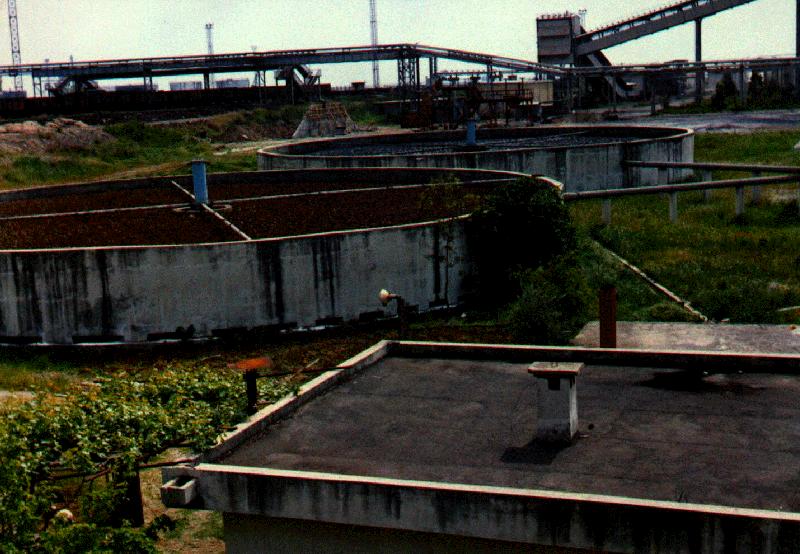
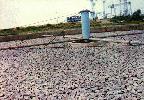
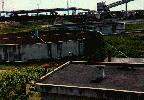
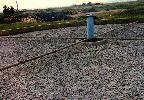
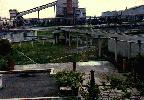
These pics related to trickling filters (rock-filled) are at my wastewater treatment plant photo collection sub-page...

From my Lovely Country... Türkiye... From Iskenderun Steel Plant...
1999 - 2000 © Toprak Home Page... You may use these pics at your web - site...
But, first of all, before downloading them, you must inform me via e - mail by clicking on the one of the buttons
located below... After getting the permit, you must locate the "TOPRAK HOME PAGE"s banner shown below into your
web - site, and you must create a link via this banner to the "TOPRAK HOME PAGE"...


Now... I want to share good slide shows related to "Attached Growth Processes" with you...
| File name |
File size ( Kb ) |
File type |
Download |
Author |
| atgrow.ppt |
860.16 |
 |
 |
Yoomin Lee |
| tdespow1.ppt |
6,533.12 |
|
|
Bruce Lesikar |
| tdespow2.ppt |
143.36 |
|
|
Anonymous |
Another good info related to "Attached Growth Processes"...
| File name |
File size ( Kb ) |
File type |
Download |
| Atcgrow.pdf |
835.58 |
 |
|
Source : Pipeline...
Literature Review...
Introduction...
The use of fixed film biological treatment systems for the treatment of domestic wastewater is not a new concept. Beginning with the demonstration by Dr. Alexander Mueller in 1865, where he showed that sewage could be purified by living organisms
in a filtration column (Peters and Alleman, 1982), the science and technology associated with the treatment of sewage has been extensively researched. This review of the literature aims to provide a brief history of the technological advances to the process of fixed film wastewater treatment, discuss recent advances in the field of denitrification in fixed film anoxic zones and explain the process of biological nitrogen removal.
History of Fixed Film Systems...
Mueller’s development of the first fixed film system in 1865 occurred in a period of history where the western world
was in the midst of the industrial revolution and with the urbanisation of cities came the spread of disease due to poor sanitisation (Peters and Alleman, 1982). Between 1865 and 1908 the method of fixed film biological treatment was further advanced and implemented with the emergence of the trickling filter and contact bed (The Dow Chemical Company, 1971).
Between 1925 and 1950 extensive efforts were made to improve and upgrade trickling filter performance, including the development and adoption of technical standards for design loading, bed construction and system operation (Peters and Alleman, 1982). High-rate designs were also developed to increase the hydraulic capacity of trickling filters (Peters and Alleman, 1982). Early Rotating Biological Contactors (RBCs) were also de veloped during this period (Peters and Alleman, 1982).
However with the emergence of the activated sludge process and rapid advancements in the field of suspended growth
biological treatment, the popularity of fixed film systems diminished (Peters and Alleman, 1982). Yet, the past 50 years
has seen the emergence of plastic packing for trickling filters, advancements to RBC technology and the development of submersed fixed film systems (Peters and Alleman, 1982).
Denitrification in Fixed Film Anoxic Zones...
During the last 50 years, increased environmental awareness has led to an increased demand for not only the removal of biochemically oxidisable material, as has been the focus in the past, but also the removal of nutrients (particularly Nitrogen). This has led to a rethink of the process of wastewater treatment worldwide and renewed interest in fixed film bioreactors.
As discussed in Dee et al. (1994), in the 1970s WRc plc performed extensive tests on parallel, pilot, submersed fixed film filters operating in single filtration mode (without recirculation) at loading rates of about 0.1 kgBOD/m3.d to evaluate the performance of different types of media. The results of these tests indicated that single -filtration was only capable of removing up to 50 % of the total nitrogen (Dee et al., 1994). This research however only looked at single pass treatment of the wastewater and the filters were not maintained in an anoxic environment.
WRc plc also demonstrated that nitrogen could be removed from effluent in pilot flooded pebble or sand beds using methanol
as the carbon source (Bailey and Thomas, 1975). The use of Methanol as the carbon source for post-anoxic submersed fixed
film systems has also been researched by Hawkins et al. (1976). Although the use of methanol as a carbon source for postanoxic systems have had proven success in the biological removal of nitrogen, the operating costs associated with this methanol dosing makes it an expensive process (Dee et al., 1994).
Due to the expense associated with methanol dosing in post-anoxic systems, extensive research has also been conducted into the denitrification ability of pre-anoxic systems. Submerged mineral-media reactors, comprising an upstream anoxic unit
which treats a mixture of settled sewage and nitrified effluent recycled from a downstream aerobic stage, have been used
to remove total nitrogen with removal rates between 70 % and 80 % recorded (Dee et al., 1994). However in order to achieve these removal rates large recycles (often 5-10 times raw sewage inflow) are required. This increases capital and operating costs due to the pumping requirements.
Dee et al. (1994) conducted a case study to evaluate the use of pre-denitrification versus postdenitrification (using a methanol dosed deep-bed sand filter) for nitrogen removal at a low-rate biological filter works. The findings of this
study indicated that pre-denitrification was effective for the removal of nitrogen and were cost-competitive with the tertiary denitrification process involving methanol dosing (Dee et al., 1994). Therefore the costs associated with predenitrification are comparative to post -denitrifying sand filters with methanol dosing.
The high costs associated with pre-anoxic systems are mainly due to the extra capital requirements and operating costs of
the pumps. Pre-anoxic systems usually require large recycle streams which need to be pumped back to the trickling filter feed. This recycle stream can be up to ten (10) times the raw effluent flowrate. Therefore the costs associated with pumping and the extra capital costs associated with these pumps results in the pre-anoxic system costing about the same as a post-anoxic system which has methanol dosing.
The recent challenge for researches in this field has been to develop a post-anoxic system, capable of effective denitrification, without the need for methanol dosing. Researchers have conducted studies into the use various internal carbon sources such as activated sludge (Schreff and Wilderer, 1998 and Sekoulov et al., 1990) or biologically hydrolysed sludge (Æsøy and Ødegaard, 1994). However the use of these carbon sources requires extra infrastructure as the sludge has
to be either degraded anaerobically or aerobically or hydrolysed. This increases the initial capital outlay associated
with the plant.
Biological Denitrification...
Denitrification is the term used to describe the biological reduction of nitrate to nitric oxide, nitrous oxide and nitrogen gas (Metcalf and Eddy, 2003). Metcalf and Eddy (2003) report that there are two modes of nitrate removal that can occur in biological processes – assimilating and dissimilating nitrate reduction.
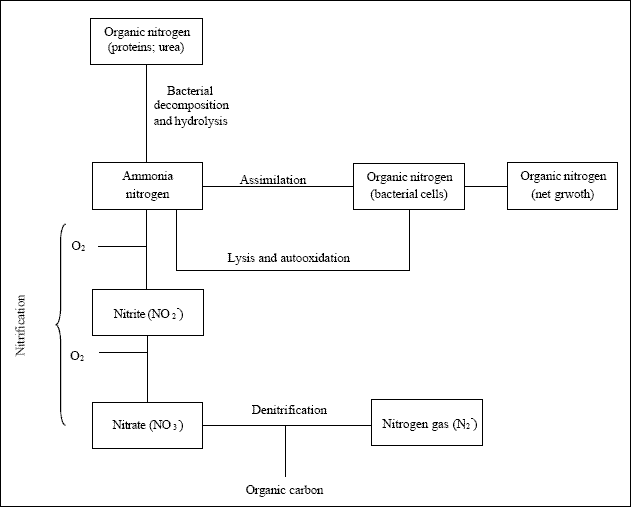
As figure given above illustrates, assimilating nitrogen reduction involves the reduction of nitrate to ammonia for use in cell synthesis (Metcalf and Eddy, 2003).
The process of biological denitrification or dissimilating nitrate reduction involves the biological oxidation of many organic substrates in wastewater treatment using nitrate and nitrite as the electron acceptor instead of oxygen (Metcalf
and Eddy, 2003). Under anoxic (no free dissolved oxygen or limited dissolved oxygen) conditions bacteria use the nitrate
and nitrite as their oxygen source. The reactions for biological denitrification, given in Metcalf and Eddy (2003), are
expressed in equations given below :
NO3- > NO2- > NO > N2O > N2
The last three components of eq. (ie. NO, N2O and N2) are gaseous and can be released into the atmosphere. The reaction stoichiometry for biological denitrification using wastewater or methanol as the carbon source (electron donator) is given in the following equations :
Wastewater :
C10H19O3N + 10 NO3- > 5 N2 + 10 CO2 +
3 H2O + NH3 + 10 OH-
Methanol :
5 CH3OH + 6 NO3- > 3 N2 + 5 CO2 + 7 H2O + 6 OH-
The carbon source requirements for the reduction of nitrate to nitrite and nitrite to nitrogen gas are given by
Pochana (1999) as 1.14 mg COD / mg NO3- - N and 2.28 mg COD / mg NO2- - N,
respectively. Therefore, according to Pochana (1999), the total carbon requirement for complete biological
denitrification to occur is 3.42 mg COD / mg NO3- - N. Barth et al. (1968) estimated that,
as a general approximation, 4 grams of BOD is needed per gram of NO3- reduced.
Trickling Filter Design...
As discussed previously trickling filters have been used for many years, therefore extensive research has been
conducted into the mechanisms which occur within trickling filters and different ways of designing such systems.
The approach used for this design is based on predominately empirical relationships used to determine the variation of substrate concentration with filter depth. Due to the constraints of the design, conventional plastic packing was taken
to be the packing used within the system as this form of packing provides a high specific surface area, which enables efficient contaminant removal, and is light which reduces the risk of damaging the unit and enables a tall tower
trickling filter, rather than a traditional shallow trickling filter.
According to Metcalf and Eddy (2003) conventional plastic packing is characterised by the following physical
properties :
- Nominal Size (mm) : 61 x 61 x 122
- Approximate unit weight (kg / m3) : 30 - 80
- Approximate specific surface area (m2 / m3) : 90
- Void Space (%) : > 95
The trickling filter has two roles – to biologically oxidise BOD and to biologically nitrify NH4-N. The
biological oxidation occurs due to the growth of heterotrophic bacterial while the biological nitrification involves autotrophic bacteria. Metcalf and Eddy (2003) state that both the biological oxidation of BOD and the biological nitrification of NH4-N occur under oxygen rich conditions as expressed in the stoichiometric expressions
eqs. given below :
Total biological oxidation reaction :
COHNS + O2 + Nutrients > Bacteria > CO2 + NH3 + C5H7NO2 + Other end products
C5H7NO2 + 5 O2 > Bacteria > 5 CO2 + 2 H2O + NH3 + Energy
Total biological nitrification reaction :
NH4+ + 2 O2 > NO3- + 2 H+ + H2O
In order to determine the variation of the concentration of the BOD and NH4-N over the depth of the trickling filter the Schulze equation and the Okey and Anderson nitrification rate equation respectively were used. These equations with their associated nomenclature are provided below.
Trickling Filter Design Calculations...
Design Conditions...
Influent Characteristics...
| Item |
Unit |
Primary effluent |
| Flow |
m3 / day |
0.10 |
| BOD (Soluble) |
mg / L |
150.00 |
| TSS |
mg / L |
80.00 |
| NH4-N |
mg / L |
25.00 |
| TKN |
mg / L |
25.00 |
Packing Characteristics...
- Constant characteristic of packing used : n = 0.5
- Approx. specific surface area of packing (m2 / m3) As = 90 (plastic - conventional)
Trickling Filter Characteristics...
- Filter height (m) = 1.00
- Filter diameter (m) = 0.24
- Filter cross section area (m2) = 0.05
Equations...
( 1 ) Concentration of BOD in trickling filter with respect to depth ;
SE = ( SO ) { exp { [ ( - k ) ( D ) ] / ( Qn ) } }
k = ( k1 ) [ ( D1 ) / ( D2 ) ]0.5 [ ( S1 ) / ( S2 ) ]0.5
Nomenclature :
SE = BOD concentration in settled filter effluent, mg / L (g / m3)
SO = Influent BOD concentration, mg / L (g / m3)
k = Normalised value of k for the site-specific packing depth and influent BOD concentration
D = Depth of packing, m
Q = Hydraulic application rate, m3 / m2 . day
n = Constant, characteristic of packing used
k1 = k value at depth of 6.1 m and influent BOD of 150 mg / L (g / m3)
S1 = 150 g BOD / m3
S2 = Site specific influent BOD concentration, g BOD / m3
D1 = 6.1 m packing depth, m
D2 = Site specific packing depth, m
From Metcalf and Eddy (2003) :
k1 = 0.210 (L / s) 0.5 / m2 (for Domestic Sewage)
n = 0.50 for conventional plastic packing
( 2 ) Concentration of ammonia nitrogen in trickling filter with respect to depth ;
Rn = ( 0.82 ) [ ( BOD ) / ( TKN ) ]- 0.44
Nomenclature :
Rn = Nitrification rate, g N / m 2 . day
TKN / BOD = Influent BOD to TKN ratio, g / g
Limiting Factors...
Carbon oxidation occurs in the upper portion of the trickling filter due to the higher specific growth rate of
heterotrophic bacteria than the autotrophic nitrifying bacteria when the substrates for both are not present in rate
limiting concentrations (Wanner and Gujer, 1985). The transition from biological oxidation to biological nitrification
occurs at a soluble BOD concentration of 20 mg/L (Daigger et al, 1994). Therefore if :
- BOD concentration > 20 mg/L No nitrification occurs.
- BOD concentration < 20 mg/L No BOD oxidation occurs.