Storm Overflows...

Wrong Connections to the Separate System...

The " Working Party on Storm Sewage ( Scotland ) " demonstrated theoretically that only a small percentage of wrong connections of foul discharges to surface water drains could nullify the advantage of adopting the totally separate system. The relationship between the number of wrong connections and the increase in BOD load to the stream is derived below. Studies showed that on the basis of conventional treatment the complete separation of foul sewage could reduce the total BOD loaad on a watercourse by about 10 % ( but increased the suspended solids by about 90 % ). It was also shown that when the wrong connections were only about one in a hundred, an advantage of this order in respect of BOD would be nitrified. The effects of mistakes of this kind on the separate system is evident. To determine the effect of wrong connections on the polluting load discharges to a watercourse ;

n : number of wrong connections expressed as a percentage and let the same proportion exist between the surface water and the foul sewers
Q F : average volume of foul sewage passed to sewage works per annum
B F : average BOD concentration of foul sewage
L F : average BOD load of foul sewage
Q S : average volume of surface water from impervious area per annum
B S : average BOD concentration of surface water
L S : average BOD load of surface water
dL : percentage change in BOD load to watercourse
E : overall removal efficiency at notional sewage works, assumed constant
K = ( Volume of surface water per annum ) / ( Volume of foul sewage per annum ) = ( Q S ) / ( Q F )

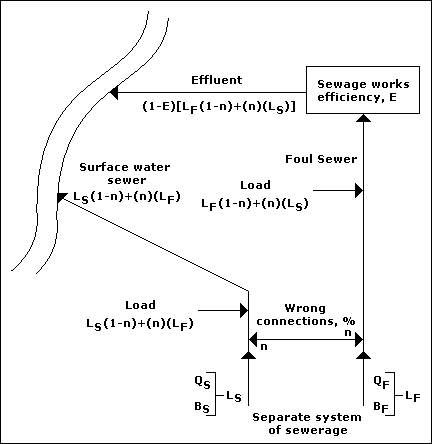
Referring to figure given below ;

( 1 ) Load in foul sewer due to foul sewage = ( L F ) ( 1 - n )
Load in foul sewer due to surface water = ( n ) ( L S )
Load to sewage works = ( L F ) ( 1 - n ) + ( n ) ( L S )
Load in effluent from sewage works = ( 1 - E ) [ ( L F ) ( 1 - n ) + ( n ) ( L S ) ]

( 2 ) Load in surface water sewer due to storm water = ( L S ) ( 1 - n )
Load in surface water sewer due to foul sewage = ( n ) ( L F )
Load discharged from surface water sewer = ( L S ) ( 1 - n ) + ( n ) ( L F )

( 3 ) Total load to watercourse = ( 1 - E ) [ ( L F ) ( 1 - n ) + ( n ) ( L S ) ] + ( L S ) ( 1 - n ) + ( n ) ( L F )
= ( 1 - E ) [ L F - ( n ) ( L F ) + ( n ) ( L S ) ] + ( L S ) ( 1 - n ) + ( n ) ( L F )
= L F - ( n ) ( L F ) + ( n ) ( L S ) - ( E ) ( L F ) + ( E ) ( n ) ( L F ) - ( E ) ( n ) ( L S ) + L S - ( n ) ( L S ) + ( n ) ( L F )
= ( E ) ( n ) ( L F - L S ) + L F + L S - ( E ) ( L F )

With no wrong connections, i.e. n = 0 ;

Load = L F + L S - ( E ) ( L F ) = ( 1 - E ) ( L F ) + L S

( 4 )
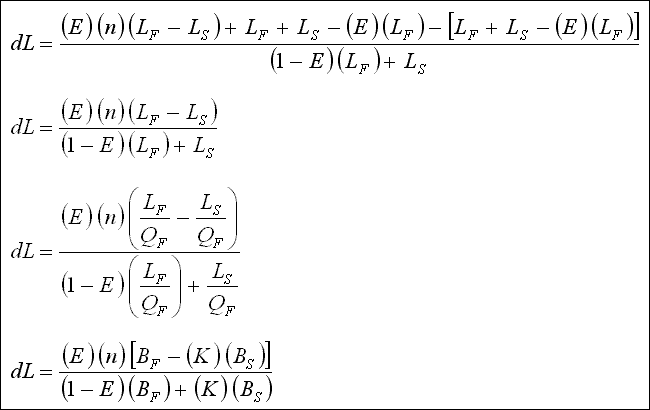
( 5 ) K = ( Q S ) / ( Q F )

and Q S = ( 10 ) ( A ) ( C ) ( I )

where ; Q S : the volume of surface water run - off per annum ( m 3 ), A : the contributing area ( ha ), C : the overall run - off coefficient and I : the annual precipitation ( mm ).

Q F = [ ( P ) ( G ) ( 365 ) ] / ( 1,000 )

where ; Q F : the volume of foul sewage per annum ( m 3 ), P : the population and G : the DWF ( L / hd . d ).

K = [ ( 10 ) ( A ) ( C ) ( I ) ( 1,000 ) ] / [ ( P ) ( G ) ( 365 ) ] = [ ( 27.4 ) ( A ) ( C ) ( I ) ] / [ ( P ) ( G ) ]
Example...

For a housing development sewered on the totally separate system and serving 5,000 persons at 100 / ha, estimate the percentage increase in load to the watercourse for a 1 in 100 connection error berween the house connections and the sewers, assuming the sewage works is 90 % efficient, and for the following condition ;

( a ) Foul sewage ; DWF = 270 L / hd . d at BOD = 200 mg / L
( b ) Surface water ; BOD = 10 mg / L, impermeability = 40 %, yearly run - off 0.70 of rain falling on impermeable area, annual precipitation = 1,000 mm.

K = [ ( 27.4 ) ( 50 ) ( 0.4 ) ( 0.7 ) ( 1,000 ) ] / [ ( 5,000 ) ( 270 ) ] = 0.284

dL = { ( 1 ) ( 0.9 ) [ 200 - ( 0.284 ) ( 10 ) ] } / [ ( 1 - 0.9 ) ( 200 ) + ( 0.284 ) ( 10 ) ] = 7.8 %

Economic Considerations...

In many cases there will be a clear financial advantage in adopting the combined system of sewerage instead of separate sewers, and the savings may be used in part to give protection to streams should it be necessary to do so. In a study made by the " Working Party on Storm Sewage ( Scotland ) " it was found that even allowing for storm tanks at all overflows on sewers the cost of the combined system was 15 - 35 % less than the separate system, depending on the number and location of overflows.

Comparison of Sewerage Systems...

Advantages :

( 1 ) Rivers are not deprived of their due share of run - off from their catchments ; the exclusion of storm overflows eliminates pollution from untreated or partially treated sewage.
( 2 ) Where pumping of sewage is necessar, capital and running costs can be reduced.
( 3 ) Economies ar sewage treatment works, e.g. by elimination of storm tanks and of grit removal facilities where appropriate.
( 4 ) More efficient sewage treatment ; the smaller variations in flow are more favourable to the performance of septic tanks, package plants and treatment processes generally ; the higher temperature of foul sewage during the winter months also facilitates treatment.

Disadvantages :

( 1 ) Two sewer systems are required and the additional pipework includes the duplication of house drains ; consequently the cost of piping as compared with combined systems can be increased by 50 - 100 %.
( 2 ) Wide trenches may pose construction and supervision problems.
( 3 ) There is a risk of wrong connection of foul drains to the surface water sewers ; discharge from the foul sewer to the surface water sewer can also occur at dual manholes.
( 4 ) The discharges from surface water sewers are seldom clean and occur more frequently than those from a combined system with properly designed overflows ; in combined systems some surface water and many small storms receive a degree of treatment in storm tanks and other unit treatment processes at sewage works without overflow necessarily occuring.

Overflow Settings...

In relation to the " setting " of storm overflow weirs it is instructive to consider the effect that the strength of industrial effluents can have on the quality of the spilled storm sewage.

Example...

For a population of 1,000 served by a combined system in which the maximum storm flow is say 76 x DWF, calculate for average conditions ( and disregarding the BOD of the surface water itself ) the strength of sewage spilled from a storm overflow weir set at 6 x DWF, where ;

( a ) The sewage is domestic in character and amounts to 182 L / hd . d with a five - day BOD of 324 mg / L.
( b ) In addition a trade effluent is discharged to the sewer, amounting to 60 L / hd . d with a five - day BOD of 1,000 mg / L.

( 1 ) Domestic sewage only :

DWF = [ ( 1,000 ) ( 182 ) ] / ( 1,000 ) = 182 m 3 / d
Weir setting = ( 6 ) ( 182 ) = 1,092 m 3 / d
Total storm flow = ( 76 ) ( 182 ) = 13,832 m 3 / d

( a ) When overflow begins at 1,092 m 3 / d the storm sewage is composed of 910 parts of surface water and 182 parts of domestic sewage, i.e. a dilution of 5 to 1 and a weir setting of 6 x DWF.

BOD of spilled storm sewage = ( 324 ) / ( 6 ) = 54 mg / L

( b ) When the storm flow reaches its peak of 13,832 m 3 / d the sewage is composed of 13,650 parts of surface water and 182 parts of domestic sewage, i.e. a dilution of 75 to 1.

BOD of spilled storm sewage = ( 324 ) / ( 76 ) = 4.3 mg / L

( 2 ) Domestic sewage plus trade effluent :

( A ) Consider overflow coming into operation at 6 x DWF of domestic sewage ;

DWF = { [ ( 1,000 ) ( 182 ) ] / ( 1,000 ) } + { [ ( 1,000 ) ( 60 ) ] / ( 1,000 ) } = 182 + 60 = 242 m 3 / d

Average strength of mixed sewage = [ ( 182 x 324 ) + ( 60 x 1,000 ) ] / ( 242 ) = 492 mg / L

( a ) When overflow begins at 1,092 m 3 / d the storm sewage is composed of 850 parts of surface water and 242 parts of mixed domestic sewage, i.e. a dilution of 3.5 to 1 with a weir setting equivalent of 4.5 x DWF.

BOD of spilled storm sewage = ( 492 ) / ( 4.5 ) = 109 mg / L

( b ) When the storm flow reaches its peak of 13,832 m 3 / d the sewage is composed of 13,590 parts of surface water and 242 parts of mixed domestic and industrial sewage, i.e. a dilution of 56 to 1.

BOD of spilled storm sewage = ( 492 ) / ( 57 ) = 8.6 mg / L

( B ) Consider overflow coming into operation at 6 x DWF of domestic sewage plus trade effluent ;

DWF = 182 and 60 as before = 242 m 3 / d.
Average strength of mixed sewage as before = 492 mg / L
Weir setting = ( 6 ) ( 242 ) = 1,452 m 3 / d.
( i.e. 8 x DWF of domestic sewage ).

( a ) When overflow begins at 1,452 m 3 / d the sewage is composed of 1,210 parts of surface water and 242 parts of mixed domestic and industrial sewage, i.e. a dilution of 5 to 1 with a weir setting equivalent to 6 x DWF.

BOD of spilled storm sewage = ( 492 ) / ( 6 ) = 82 mg / L

( b ) When the storm flow reaches its peak of 13,832 m 3 / d, BOD of spilled storm sewage, as before = 8.6 mg / L

A new basis for the setting of overflows, corresponding to a modest improvement over traditional practice was therefore recommended in terms of " Formula A ", i.e. ;

Setting Q = DWF + ( 1,360 ) ( P ) + ( 2 E ) ( l / d )

where ; DWF : average daily rate in dry weather including infiltration and industrial effluents from combined and / or partially separate areas ( l / d ).

DWF = ( P ) ( G ) + I + E

where ; P : population, G : average domestic ( unmetered ) water consumption ( l / hd . d ), I : infiltration ( l / d ) and E : volume of industrial effluent discharged in 24 h ( l / d ).

Q = ( P ) ( G ) + I + E + ( 1,360 ) ( P ) + ( 2 E ) = ( P ) ( G ) + ( 1,360 ) ( P ) + I + ( 3 E ) ( l / d )

In the simpler case of domestic sewage only and no infiltration ;

Q = ( P ) ( G ) + ( 1,360 ) ( P ) ( l / d )

Where areas drained on the separate system discharge sewage to a combined and / or partially separate system upstream of an overflow, the quantity passed to treatment as defined by " Formula A " should be increased by 3 DWF from the " separate " areas.

Example...

Apply " Formula A " to the previous example assuming a domestic water consumption of 182 l / hd . d. In addition find a setting which would ensure that the strength of the mixture at the commencement of overflow would be reduced to that found for domestic sewage only.

( 1 ) Domestic sewage only :

DWF = ( 1,000 ) ( 182 ) = 182,000 l / d

Setting Q = ( 1,000 ) ( 182 ) + ( 1,000 ) ( 1,360 ) = 1,542,000 l / d

Equivalent setting = ( 1,542,000 ) / ( 182,000 ) = 8.5 DWF

BOD of spilled storm sewage when overflow begins = ( 324 ) / ( 8.5 ) = 38 mg / l

( 2 ) Domestic sewage plus trade effluent :

DWF = ( 1,000 ) ( 182 ) + ( 1,000 ) ( 60 ) = 242,000 l / d

Setting Q = ( 1,000 ) ( 182 ) + ( 1,000 ) ( 1,360 ) + ( 3 ) ( 1,000 ) ( 60 ) = 1,722,000 l / d

Equivalent setting = ( 1,722,000 ) / ( 242,000 ) = 7.1 DWF

Average strength of mixed dry weather sewage ;

= [ ( 182 ) ( 324 ) + ( 60 ) ( 1,000 ) ] / ( 242 ) = 492 mg / l

Average BOD of spilled storm sewage when overflow begins = ( 492 ) / ( 7.1 ) = 69 mg / l

( 3 ) Higher setting to ensure strength of spilled mixed sewage is about 38 mg / l :

Required setting Q = ( 492 ) / ( 38 ) = 12.9 DWF

= ( 12.9 ) ( 242,000 ) = 3,121,800 l / d

Setting Q = 3,121,800 = 182,000 + 1,360,000 + ( 60,000 ) ( x )

, x = 26

Effect of Change of Setting...

The " MHLG Technical Committee " estimated the effect of changes in weir setting on the frequency, duration and volumes spilled from an hypothetical overflow based on the then current practice of expressing settings in terms of multiples of DWF. Table given below summarises the results. For example, raising the setting from 6 to 8 DWF would be expected to reduce the frequency of operation of the overflow by less than 10 %, the total duration of discharge by 25 % and the volume discharged by 21 %. Over the range of settings the volume discharged is almost inversely proportional to the setting.

Overflow setting ( x DWF ) 6 8 12 20
Excess flow ( x DWF ) 5 7 11 19
Values expressed as percentages of results for 6 DWF setting
Number of discharges per year 100 93 71 45
Total duration of discharge 100 75 44 18
Volume discharged as proportion
of rainfall on impermeable area
100 79 51 23

Types of Storm Overflow Chamber...

( 1 ) High side - weir : Weir( s ) constructed along the length of the sewer with crest( s ) above the level of the horizontal diameter of the upstream pipe.

( 2 ) Low side - weir : Weir( s ) constructed similarly, with crest( s ) below the horizontal diameter of the upstream pipe.

( 3 ) Stilling pond : A chamber designed with the object of reducing the amount of turbulence in the vicinity of the overflow. It may be rectangular in plan or expand in width from inlet to outlet. Overflow may be by side or end weirs, or syphons may be used to discharge the excess storm sewage.

( 4 ) " Sharpe and Kirkbride " : A stilling pond type of chamber in which interrelationships of dimensions were defined by its designers.

( 5 ) Vortex : An overflow where a peripheral weir and formation of a vortex are used to enable excess storm sewage to be discharged through a central shaft.

" Sharpe and Kirkbride " Storm Overflows...

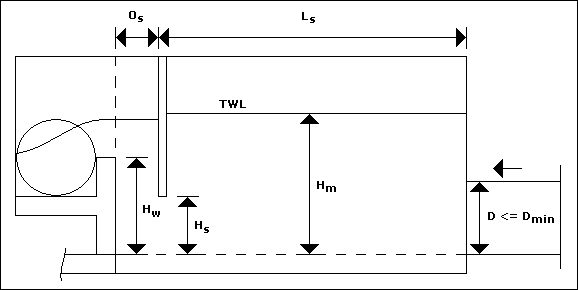
" Sharpe and Kirkbride " carried out model experimentson a stilling pond type of storm overflow chamber with an end weir discharge. From study of the flow patterns the most effective mode of operation to achieve efficient separation and retention of floating and heavy solids within the sewer was established and constants were deduced to enable the chamber dimensions to be determined. Figure and table given below indicate the various factors recommended for design purposes.

Height of weir crest
( H w )
Minimum diameter
of upstream sewer
( D min )
Chamber top water level
( maximum )
( H m )
Height of scum-board
( H s )
0.9 D 0.848 Q 2 / 5 1.60 D min 0.5 D
1.0 D 0.828 Q 2 / 5 1.70 D min 0.6 D
1.2 D 0.815 Q 2 / 5 1.85 D min 0.8 D
Note :
( 1 ) All vertical distances are measured from the invert of the upstream sewer at entry to the chamber
( 2 ) D is diameter of upstream sewer in meters
( 3 ) Q is peak design discharge of upstream sewer in m 3 / s
( 4 ) Length of chamber between upstream end and scum - board L s = 4.2 D min
( 5 ) Width of chamber B= 2.5 D min
( 6 ) Distance, scum - board to weir O s = 0.5 D min
( 7 ) There is an ambiguity in table given above in that H m
must be controlled basically by H w , the height of the weir.

( 1 ) Efficiency is improved as the weir height is raised and if the crest is below the soffit of the inlet pipe the flow pattern is poor. The weir height should preferably be between 1.0 D and 1.3 D
( 2 ) Increasing the length and width of chamber beyond the minimum values recommended by " Sharpe and Kirkbride " would not necessarily improve efficiency, but it was demonstrated that worthwhile improvements can be obtained by increasing only the length of the chamber.
( 3 ) The position of the baffle has an important effect upon efficiency.
( 4 ) The central channel of reducing circular cross - section performed well in respect of the passage of fast - sinking particulate to treatment. Once particles entered the stream they usually remained within it and this type of channel was therefore recommended.
( 5 ) Comparison of space requirements and construction costs with those for other devices may favour the " Sharpe and Kirkbride " type of chamber.

The design procedure recommended by " Sharpe and Kirkbride " is as follows ;

( a ) Determine the minimum inlet pipe diameter by substitution in the formula for D min .
( b ) Deduce maximum water level in the chamber and check that no flooding will result.
( c ) Deduce the remaining chamber dimensions.

Example...

For a population of 9,000 use the " Sharpe and Kirkbride " coefficients to design a stilling pond type of storm overflow chamber to pass a nominal flow of 12 x DWF onwards through a 300 mm outlet assuming a dry weather flow of 182 l / hd . d and a maximum storm flow of 75 x DWF.

DWF = [ ( 9,000 ) ( 182 ) ] / ( 1,000 ) = 1,638 m 3 / d = 0.01896 m 3 / s

Maximum storm flow = ( 75 ) ( 0.01896 ) = 1.422 m 3 / s

Adopting ( say mid - value ) coefficients to proportion chamber ;

* D min = ( 0.828 ) ( 1.422 2 / 5 ) = D = 0.95 m

* H m = ( 1.70 ) ( 0.95 ) = 1.62 m

* L s = ( 4.2 ) ( 0.95 ) = 4.0 m

* B = ( 2.5 ) ( 0.95 ) = 2.4 m

* H w = ( 1.0 ) ( 0.95 ) = 0.95 m

* H s = ( 0.6 ) ( 0.95 ) = 0.57 m

* O s = ( 0.5 ) ( 0.95 ) = 0.48 m

Outlet : In this case, where a nominal flow of 12 x DWF is to be passed onwards, the throttle will be designed to pass about 11 x DWF when overflow commences, and the increase in rate corresponding to maximum storm conditions checked on the basis of the depth of flow over a board - crested weir. The orifice would be positioned accordingly and the floor of the chamber sloped downwards from the invert of the incoming sewer to the appropriate level at the outlet.

Orifice : For an orifice in a sharp - edged plate the coefficient of discharge is about 0.632. Assuming that the overflow weir begins to discharge at 11 x DWF through the orifice, i.e. at 11 x 0.01896 = 0.2086 m 3 / s

Q = ( C D ) ( A ) [ ( 2 x g ) ( H ) ] 1 / 2

where ; Q : discharge ( m 3 / s ), C D : coefficient of discharge, A : area of orifice ( m 2 ), H : head lost to centre of orifice, assuming a free discharge and g : gravitational acceleration ( m / s 2 ).

0.2086 = ( 0.632 ) ( PI x 0.30 2 / 4 ) [ ( 2 x 9.81 ) ( H ) ] 1 / 2

H = 1.11 m

Weir : Assume that under the specified maximum flow conditions the orifice will pass about 13 x DWF, i.e. that the weir will spill about 75 - 13 = 62 x DWF = 62 x 0.01896 = 1.1755 m 3 / s. For a square - crested weir C D is about 0.67 for heads of between 0.3 and 0.7 x crest height.

Q = ( 2 / 3 ) ( C D ) ( B ) ( H 3 / 2 ) ( 2 x g ) 1 / 2

where ; Q : discharge ( m 3 / s ), B : width ( m ) and H : head over weir ( m ).

1.1755 = ( 2 / 3 ) ( 0.67 ) ( 2.40 ) ( H 3 / 2 ) ( 2 x 9.81 ) 1 / 2

H = 0.39 m

( N.B. Head measured above invert of incoming sewer = 0.95 + 0.39 = 1.34 m, i.e. < H MAX )

Range of discharge through orifice : Head over orifice when head over weir = 0.39 m = 1.11 + 0.39 = 1.50 m

Q = ( C ) ( A ) [ ( 2 x g ) ( H ) ] 1 / 2

Q = ( 0.632 ) ( PI x 0.30 2 / 4 ) [ ( 2 x 9.81 ) ( 1.50 ) ] 1 / 2

Q = 0.243 m 3 / s = 12.8 x DWF

i.e. orifice will pass between about 11 and 13 x DWF downstream between the commencement of overflow and the head over the weir rising to 0.39 m.

Side Weirs...

For a given flow of water in a channel there are at any particular section two depths at which the sum of the pressure and kinetic energies is equal. There is an intermediate depth at which the sum of the pressure and kinetic energies is a minimum. This depth is called the critical depth and at this depth the maximum discharge will occur. In a rectangular channel ;

d C = { ( Q 2 ) / [ ( g ) ( B 2 ) ] } 1 / 3

The corresponding expression for a circular pipe quoted by " Braine " is ;

( d C / D ) = ( 0.483 ) ( Q 2 / D 5 ) 1 / 3 + ( 0.083 )

( accurate only when 0.30 < ( d C / D ) < 0.9 ), where ; d C : critical depth of flow ( m ), Q : discharge in main channel ( m 3 / s ), B : width of channel ( m ), D : pipe diameter ( m ) and g : gravitational acceleration ( m / s 2 ).

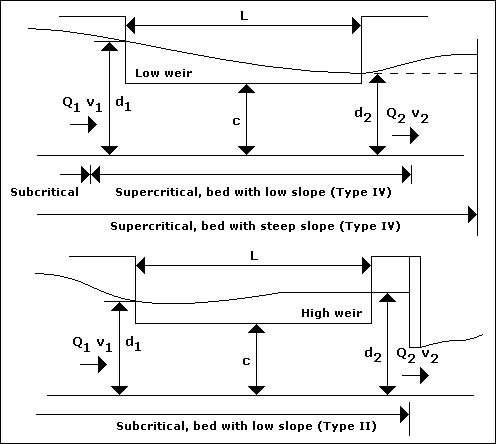
" Frazer " identified five different types of side - weir flow, dependent on the hydraulics and geometry of the arrangements. With Types III and V hydraulic jumps occur along the weir and conditions cannot be satisfactorily analysed. Types I, IV and II are identified on figures given below in which ;

d 1 , d 2 : depths of flow at upstream and downstream ends of channel ( m ).
Q 1 , Q 2 : discharges at upstream and downstream ends of channel ( m 3 / s ).
v 1 , v 2 : velocities at upstream and downstream ends of channel ( m / s ).
c : height of crest above channel ( m ).
L : length of weir ( m ).


( 1 ) Type I mode occurs in a channel of mild slope when the crest is below the critical depth corresponding to the initial flow Q 1 and the crest is long. The upstream flow is subcritical and the water surface is drawn down as it approaches the weir. The flow becomes shooting ; the flow along the weir channel is supercritical and a hydraulic jump may form in the channel downstream. Type I flow will occur only when the upstream specific energy exceeds twice the crest height. A rather similar mode may occur in a steeply sloping channel and is characterised by being supercritical throughout, with a falling profile along the weir ( Type IV ).

( 2 ) Type II mode occurs with a higher side - weir in a channel of mild slope when the crest is above the critical depth. A throttle is located at the downstream end to control the flow at first spill. The flow is subcritical, both in the upstream channel and along the weir. The upstream flow is drawn down as it approaches the weir but the profile rises along the weir. Type II flow will occur only when the upstream specific energy is less than twice the crest height.

( 3 ) There is a falling profile when v > [ ( g ) ( d ) ] 1 / 2 ( shooting flow ) and a rising profile when v < [ ( g ) ( d ) ] 1 / 2 ( tranquil flow ), i.e. the " Froude " number ( v ) / [ ( g ) ( d ) ] 1 / 2 , greater or less than unity, respectively.

Low Side - Weirs...

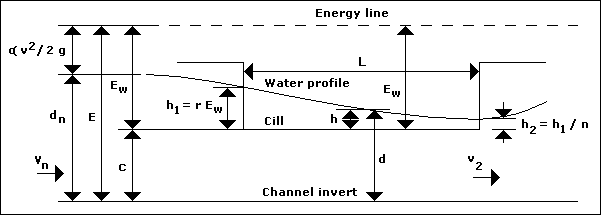
Low side - weirs should generally be avoided and replaced by more suitable types, but in cases where physical or other conditions dictate their adoption a falling profile method of design attributed to " Ackers " may be followed. Referring to figure given below, for a channel of rectangular cross - section ;


E w = { [ ( ALPHA ) ( v ) 2 ] / ( 2 x g ) } + ( BETA ) ( h )

Just upstream of the weir and above the influence of draw - down, i.e. at normal depth, d is not likely to be less than 1.2 and BETA is unity.

E w = { [ ( 1.20 ) ( v n ) 2 ] / ( 2 x g ) } + ( d n - c )

at the outlet ;

E w = { [ ( 1.40 ) ( v 2 ) 2 ] / ( 2 x g ) } + ( 0.80 ) ( h 2 )

Weir lengths are as shown in table given below.

Ratio of incoming to outgoing head
( n )
Length of weir ( L ), m
( sharp or narrow - rounded crest )
5 ( 2.03 x B ) [ ( 2.81 ) - ( 1.55 ) ( c / E w ) ]
7 ( 2.03 x B ) [ ( 3.90 ) - ( 2.03 ) ( c / E w ) ]
10 ( 2.03 x B ) [ ( 5.28 ) - ( 2.63 ) ( c / E w ) ]
15 ( 2.03 x B ) [ ( 7.23 ) - ( 3.45 ) ( c / E w ) ]
20 ( 2.03 x B ) [ ( 8.87 ) - ( 4.13 ) ( c / E w ) ]

where ; E : total energy referred to channel bed, or specific energy ( m ), E w : total energy referred to weir crest ( m ), ALPHA : velocity - distribution coefficient, BETA : pressure - distribution coefficient, h : depth of flow over weir ( m ), n : ratio h 1 / h 2 without dip - plates, r : ratio h 1 / E w , d n : normal depth of flow ( m ), v n : velocity at normal depth of flow ( m / s ), B : width of channel ( m ) and L : length of weir ( m ).

Example...

Design a low side - weir on an existing 600 mm diameter sewer laid at a gradient of 1 in 170, to reduce storm flow from 0.37 m 3 / s to 6 x DWF from a population of 3,300 at 230 l / hd . d.

( 1 ) Flows :

DWF = [ ( 3,300 ) ( 230 ) ] / [ ( 1,000 ) ( 24 ) ( 3,600 ) ] = 0.008785 m 3 / s

6 x DWF = 6 x 0.008785 = 0.0527 m 3 / s

Storm flow = 0.37 m 3 / s = ( 0.37 ) / ( 0.008785 ) = 42 x DWF

Full bore capacity ( assuming " Colebrook - White " equivalent roughness k s = 6.00 mm ) = 0.386 m 3 / s and full bore velocity = 1.36 m / s ( approximately ).

At peak flow, proportional discharge = ( 0.370 ) / ( 0.386 ) = 0.959

and proportional depth = 0.78 ; proportional velocity = 1.14

d n = ( 0.60 ) ( 0.78 ) = 0.47 m

v n = ( 1.36 ) ( 1.14 ) = 1.55 m / s

At 6 x DWF, proportional discharge = ( 0.0527 ) / ( 0.386 ) = 0.137

and proportional depth = 0.255 ; proportional velocity = 0.705

d n = ( 0.60 ) ( 0.255 ) = 0.153 m

v n = ( 1.36 ) ( 0.705 ) = 0.96 m / s

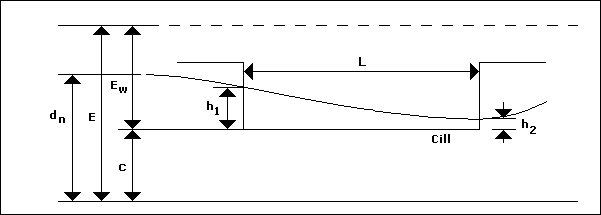
Thus, as shown on figure given below, the weir must be set at c = 0.153 mabove invert level for the overflow to come into operation at 6 x DWF, i.e. a very low weir.

( 2 ) Critical depth ( d C ) :

( d C / D ) = ( 0.483 ) ( Q 2 / D 5 ) 1 / 3 + ( 0.083 )

( d C / D ) = ( 0.483 ) ( 0.37 2 / 0.60 5 ) 1 / 3 + ( 0.083 )

d C = 0.40 m

Since d n ( 0.47 m ) > d C ( 0.40 m ) the falling profile method of design is applicable.


* d n = 0.47 m
* E = 0.617 m
* E w = 0.464 m
* h 1 = 0.23 m
* c = 0.153 m
* h 2 = 0.023 m

( A ) Consider side - weir placed on an unrestricted 600 mm diameter pipe :

( 1 ) Incoming total head at peak flow :

E w = { [ ( 1.20 ) ( 1.55 ) 2 ] / ( 2 x 9.81 ) } + ( 0.47 - 0.153 ) = 0.464 m

( c / E w ) = ( 0.153 ) / ( 0.464 ) = 0.33 i.e. < 1 ( i.e. a falling profile would occur )

h 1 = ( 0.50 ) ( 0.464 ) = 0.23 m

Adopting n = 10 ;

h 2 = ( 0.23 ) / ( 10 ) = 0.023 m

From table given above ;

L = ( 2.03 x B ) [ ( 5.28 ) - ( 2.63 ) ( c / E w ) ]

L = ( 2.03 x 0.60 ) [ ( 5.28 ) - ( 2.63 ) ( 0.33 ) ] = 5.4 m ( or a 2.7 m double - sided weir )

( 2 ) Outlet conditions :

E w = { [ ( 1.40 ) ( v 2 ) 2 ] / ( 2 x g ) } + ( 0.80 ) ( h 2 )

0.464 = { [ ( 1.40 ) ( v 2 ) 2 ] / ( 2 x 9.81 ) } + ( 0.80 ) ( 0.023 )

v 2 = 2.50 m / s

Outgoing depth = c + h 2 = 0.153 + 0.023 = 0.176 m

" Froude " number = ( 2.50 ) / [ ( 9.81 ) ( 0.176 ) ] 1 / 2 = 1.9 ( i.e. > 1 )

Proportional depth = ( 0.176 ) / ( 0.60 ) = 0.293

Proportional area = 0.245

Area = ( 0.245 ) ( PI / 4 ) ( 0.60 2 ) = 0.0692 m 2

Outflow, Q = ( A ) ( V ) = ( 0.0692 ) ( 2.50 ) = 0.173 m 3 / s

i.e. Q = ( 0.173 ) / ( 0.00879 ) = 20 x DWF ( at maximum storm time )

Hence consider installation of a throttle.

( B ) Consider a 225 mm diameter outlet sewer acting as a throttle of length say 70 m and having a free discharge :

Hydraulic gradient required to discharge 53 l / s through a 225 mm pipe ( k S = 6.0 mm ) is about 1 in 45 ;

Fall necessary = ( 70 ) / ( 45 ) = 1.56 m

v = ( 0.053 ) / [ ( PI / 4 ) ( 0.225 ) 2 ] = 1.33 m / s

Set weir at 0.9 x diameter ( i.e. 0.203 m ) above invert of throttle, so that the sewer can discharge at its maximum and the slightest increase in depth of flow would cause the outlet pipe to fill and surcharge slightly. Since " c " will exceed the " normal " depth in the incoming pipe, inflow would be slightly backed up. This would slightly affect the velocity energy term, but this has been ignored and the incoming head obtained as before ;

E w = { [ ( 1.20 ) ( 1.55 ) 2 ] / ( 2 x 9.81 ) } + ( 0.47 - 0.203 ) = 0.414 m

( c / E w ) = ( 0.203 ) / ( 0.414 ) = 0.490 i.e. < 1

Although the profile method is not strictly applicable a weir length based on n = 10 should be ample, i.e. ;

L = ( 2.03 x B ) [ ( 5.28 ) - ( 2.63 ) ( c / E w ) ]

L = ( 2.03 x 0.60 ) [ ( 5.28 ) - ( 2.63 ) ( 0.490 ) ] = 4.86 m

Owing to the probable occurrence of a standing wave, the head over the weir at the outlet will exceed one - tenth of the incoming head. The uncertainly of outgoing head requires a long control pipe to achieve reasonably accurate control under all conditions.

( Note : If ( c / E w ) is not exceed 1, then c MAX = E w ). In the foregoing example c MAX = 0.147 + ( 0.47 - c )

2 x c MAX = 0.617 and c MAX = 0.308 ( i.e. about half - pipe )

High Side - Weirs...

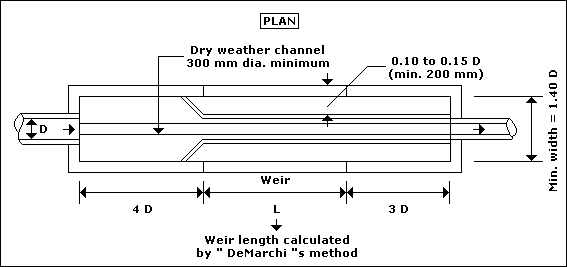
A high side - weir is a weir constructed along the length of a sewer, with the crest of the weir above the level of the horizontal diameter ( D ) of the upstream pipe. Figure given below shows relative dimensions for high side - weir chambers and incorporates an inlet length before the overflow weir and a storage section between the downstream end of the weir and the throttle.


" De Marchi ", assuming constant total energy along the weir developed a theory expressed as ;


Representing the term in the square brackets by ( PHI ) ( d / E ), the distance between two successive sections l 1 and l 2 in the channel where the depths of liquid are d 1 and d 2 , respectively is ;


where ; MU : weir coefficient and ( PHI ) ( d / E ) : depth function.

Example...

Design a high side - weir overflow in a rectangular channel placed on an existing 600 mm diameter sewer laid at a gradient of 1 in 170 to reduce storm flow.

( 1 ) General :

DWF = [ ( 3,300 ) ( 230 ) ] / [ (1,000) ( 24 ) ( 3,600 ) ] = 0.008785 m 3 / s

Q 2 = ( 6 ) ( DWF ) = ( 6 ) ( 0.008785 ) = 0.053 m 3 / s

Storm flow, Q 1 = 0.37 m 3 / s = ( 42 ) ( DWF )

B = width of channel, say ( 1.40 ) ( 0.60 ) = 0.84 m

c = minimum weir setting, say ( 0.75 ) ( 0.60 ) = 0.45 m

Velocity energy coefficient, ALPHA = 1.15

For downstream throttle, 0.053 = ( 0.632 ) ( PI / 4 ) ( 0.18 2 ) [ ( 2 ) ( 9.81 ) ( H ) ] 1 / 2

H = d 2 = 0.55 m

( 2 ) Weir coefficient :

( a ) From " Rehbock " equation ;

C D = [ 0.602 + ( 0.083 ) ( h / p ) ] [ ( h + 0.0012 ) / ( h ) ] 3 / 2

where ; h : head ( between 0.03 and 0.75 m ) and p : height of crest ( not less than 0.10 m ).

C D = [ 0.602 + ( 0.083 ) ( 0.10 / 0.45 ) ] [ ( 0.10 + 0.0012 ) / ( 0.10 ) ] 3 / 2 = 0.6316

( b ) From " Societe Suisse des Ingenieurs et Architects " equation ;

C D = [ ( 0.615 ) + ( 0.000615 ) / ( h + 0.0016 ) ] { ( 1 ) + ( 0.5 ) [ ( h ) / ( h + p ) ] 2 }

where ; ( h / p ) is not greater than 1.

C D = [ ( 0.615 ) + ( 0.000615 ) / ( 0.10 + 0.0016 ) ] { ( 1 ) + ( 0.5 ) [ ( 0.10 ) / ( 0.10 + 0.45 ) ] 2 } = 0.6313

( 3 ) Downstream velocity :

v 2 = ( Q 2 ) / ( A ) = ( Q 2 ) / [ ( B ) ( d 2 ) ] = ( 0.053 ) / [ ( 0.84 ) ( 0.55 ) ] = 0.1147 m / s

( 4 ) Specific energy :

E = ( 0.55 ) + [ ( 1.15 ) ( 0.1147 ) 2 ] / [ ( 2 ) ( 9.81 ) ] = 0.55077 m

( c / E ) = ( 0.45 ) / ( 0.55077 ) = 0.8170

( d 2 / E ) = ( 0.55 ) / ( 0.55077 ) = 0.999

( 5 ) Calculation of ( PHI ) ( d 2 / E ) :

From equation ;


( PHI ) ( d 2 / E ) = - 0.4789

( Note : sin in radians ).

( 6 ) Calculation of v 1 and d 1 :

There are two unknown values ( v 1 and d 1 ), therefore we need two equations ;

* d 1 = ( Q 1 ) / [ ( B ) ( v 1 ) ]

* E = ( d 1 ) + [ ( ALPHA ) ( v 1 ) 2 ] / ( 2 x g )

Solving of two equations ;

d 1 = 0.5063 m and v 1 = 0.870 m / s

Other values ;

* ( d 1 / E ) = 0.919

* Q 1 = 0.37 m 3 / s

* F = 0.39 < 1.0

* E = 0.551 < 2 x c ( Hence a subcritical profile is formed. )

( 7 ) Calculation of ( PHI ) ( d 1 / E ) :

Using the same equation ;

( PHI ) ( d 1 / E ) = - 4.3710

( 8 ) Weir length :


L = 3.9 m ( double - sided weir )