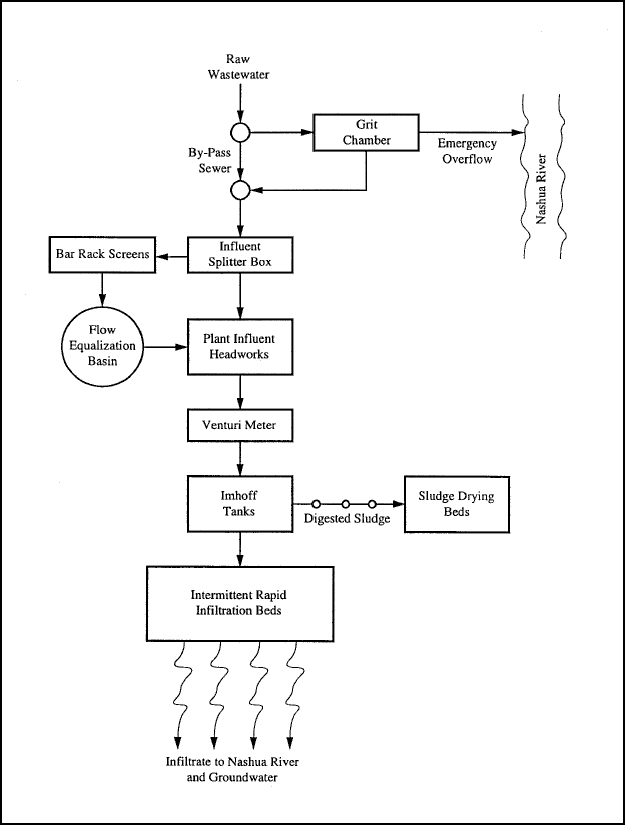
The most successful and probably the largest and longest operating U.S. Army Rapid Infiltration Basin installation is located at Fort Devens, Massachusetts (now transferred to the Commonwealth of Massachusetts under the Base Realignment and Closure plan). This facility was designed to treat 11,355,000 L/d (3,000,000 gal/d) of wastewater. The treatment system consists of a grit chamber with bypass and emergency overflow to the Nashua River; plant influent headworks (flow equalization tank, pumping station, bar racks, comminutors, wet well, Venturi flow meter and recorder), 3 Imhoff tanks, 22 rapid infiltration basins, and 4 sludge drying beds for the digested sludge from the Imhoff tanks.
( b ) Performance.
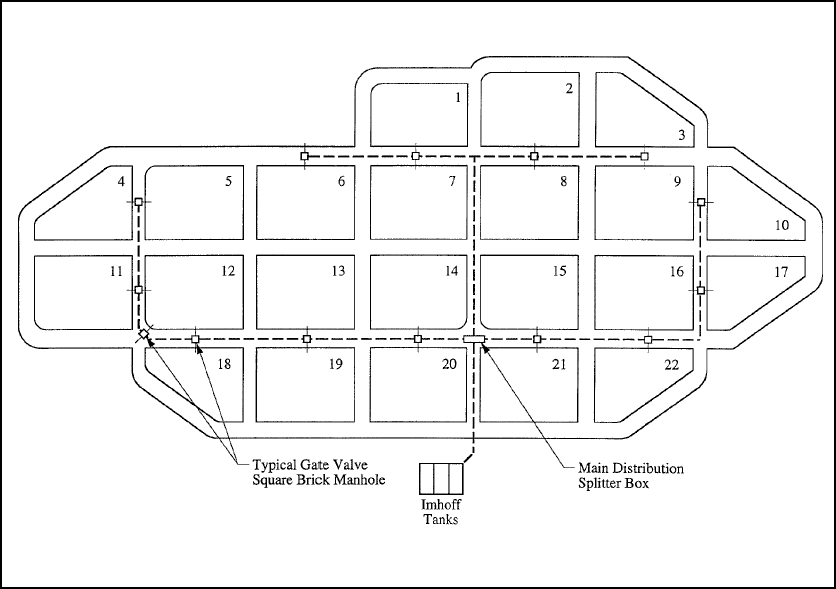
Primary treatment of the wastewater is achieved in the Imhoff tanks. The effluent from the primary treatment system is evenly distributed over the 22 rapid infiltration basins with a total area of 18.5 ha (45.7 acre), and allowed to percolate. The percolated wastewater passes vertically downward through a 27 m (90 ft) soil column almost due east and some 122 m (400 ft) to the closest bank of the Nashua River. Soil characteristics of the underlying strata consist of generally poorly graded sands or gravelly sands with underlying lenses of silty sands and sandy gravels. Silt and clays probably constitute less than five percent of the underlying soils.
( c ) Schematics.
A schematic flow diagram of the major unit processes is shown in Figure F-1. The schematic rapid infiltration basin and treated wastewater flow pattern is shown in Figure F-2.
( d ) Fort Devens.
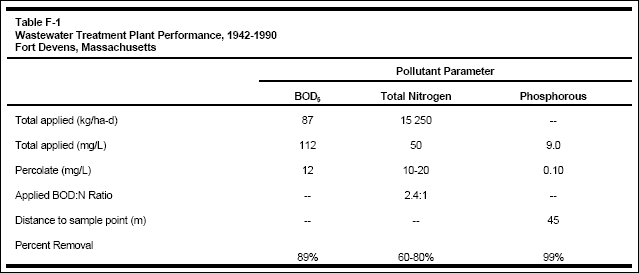
Except for relatively high nitrate (NO 3 - ) concentrations detected in the fluctuating groundwater table (sometimes over 10 mg/L), the Fort Devens plant can be considered a successful natural treatment system. Table F-1 summarizes the BOD loading and removal efficiency, and total nitrogen and phosphorous loadings and removal efficiencies from 1942 to 1990.


Figure F-1. Schematic flow diagram of Ft. Devens wastewater treatment facility.

Figure F-2. Ft. Devens schematic rapid infiltration basin plan and treated wastewater flow pattern.
