|
Oracle® Reports Building Reports
10g Release 2 (10.1.2) B13895-01 |
|
 Previous |
 Next |
|
Oracle® Reports Building Reports
10g Release 2 (10.1.2) B13895-01 |
|
 Previous |
 Next |
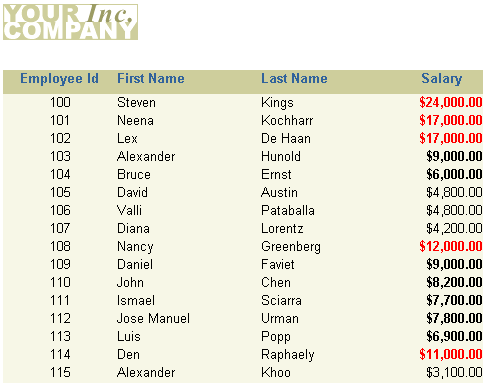
In this chapter, you will learn about reports that display highlighted values based on one or more conditions. By following the steps in this chapter, you can generate the report output shown in Figure 23-1.
Figure 23-1 Conditional highlighting report output

Concepts
You can create a format trigger that will change the appearance of retrieved data depending on factors you define.
You can use the Conditional Formatting dialog box to create this format trigger, or you can manually create them using the PL/SQL Editor. The steps in this example will show you how to use the Conditional Formatting dialog box, then display the code in the PL/SQL Editor to see how the format trigger was automatically generated by Reports Builder.
With conditional highlighting, you can format specified portions of a report's output when certain criteria are met.
Data Relationships
This report uses one query to fetch all data.
Layout
This report uses a tabular layout style. To add conditional highlighting, you will use the Conditional Formatting dialog box to determine which names and salaries will be highlighted in the report output.
Example Scenario
In this example, you will create a report for managers that shows a complete list of employees in the company, but also highlights employee salaries that are greater than or equal to $10,000. You also need to indicate which employees' salaries are between $4,999 and $10,000. In this example, you will use conditional formatting to highlight these figures in bold and red text.
As you build this example report, you will:
Create a basic tabular report using the Report Wizard to included a single query.
Add conditional formatting to the report using the Conditional Formatting dialog box to highlight specific data in the report.
Examine the conditional format trigger code using the PL/SQL Editor, for the format trigger generated by Reports Builder.
To see a sample report that uses conditional highlighting, open the examples folder named condhigh, then open the Oracle Reports example report named condhigh.rdf. For details on how to open it, see "Accessing the Example Reports" in the Preface.
To build the example in this chapter, you must have access to the Human Resources sample schema (HR) provided with the Oracle Database. If you do not know if you have access to this sample schema, contact your database administrator.
The steps in this section will show you how to use the Report Wizard to build a simple tabular report.
To create a tabular report:
Launch Reports Builder (or, if already open, choose File > New > Report).
In the Welcome or New Report dialog box, select Use the Report Wizard, then click OK.
If the Welcome page displays, click Next.
On the Report Type page, select Create Paper Layout Only, then click Next.
On the Style page, type a Title for your report, select Tabular, then click Next.
On the Data Source page, click SQL Query, then click Next.
On the Data page, enter the following SELECT statement in the Data Source definition field:
SELECT ALL EMPLOYEES.FIRST_NAME, EMPLOYEES.LAST_NAME,
EMPLOYEES.EMPLOYEE_ID, EMPLOYEES.SALARY
FROM HR.EMPLOYEES
|
Note: You can enter this query in any of the following ways:
|
Click Next.
|
Note: If you are not already connected to a database, you will be prompted to connect to the database when you click Query Builder or Next. Ensure that you connect to a database that has the appropriate schema for this example. Section 23.1, "Prerequisites for this example" describes the sample schema requirements for this example. |
On the Fields page, click the right arrow (>) to move the following fields to the Displayed Fields list, then click Next. Make sure you move them in the following order:
EMPLOYEE_ID
FIRST_NAME
LAST_NAME
SALARY
On the Totals page, click Next.
On the Labels page, click Next.
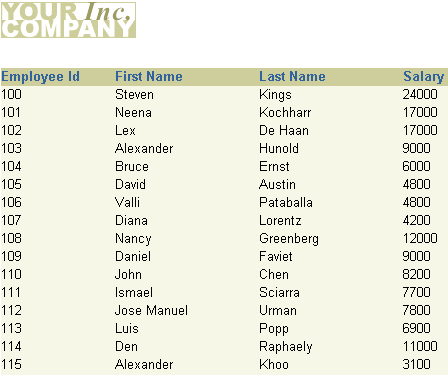
On the Template page, select Predefined Template and click Beige, then click Finish to preview your report output in the Paper Design view. It should look something like this:
Figure 23-2 Paper Design view for the initial tabular report

Now, let us format the data to make it more meaningful.
To format the report:
In the Paper Design view, select the Salary column by clicking once on the column of data.
Click the Currency button in the toolbar. A currency symbol immediately appears next to all of the values.
Click the Commas button.
Click the Add Decimal button twice. Two decimal places are added to the right of the decimal point.
The Salary column of your report should now look like this:
Change the alignment of your columns by doing the following:
Click the Salary column heading, then click the Align Center button in the toolbar.
Click the Salary column once, then click the Align Right button in the toolbar.
While the Salary column is selected, Shift-click to select the column heading too, then click and drag one of the right black squares to size the column and column heading.
Click the Employee Id column heading, Shift-click to select the Employee Id column too, then click the Align Center button in the toolbar.
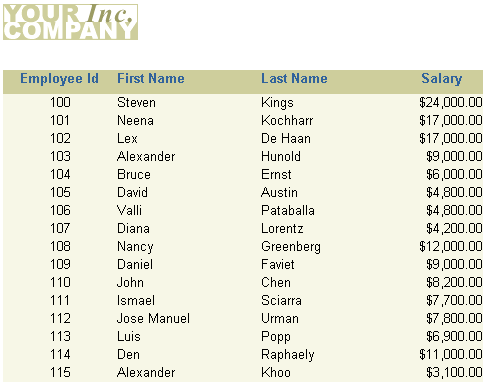
The Paper Design view of your report should now look like this:
Figure 23-4 Paper Design view of the tabular report

Save your report as condhigh_your_initials.rdf.
The steps in this section will show you how to add conditional formatting so that salaries greater than or equal to $10,000 will be highlighted in bold, red text, and salaries between $4,999 and $10,000 will be highlighted in bold text.
Since the data retrieved cannot be both greater than or equal to $10,000 and between $4,999 and $10,000, you will need to create two separate format exceptions. In this section, you will see how to create each distinct format exception.
To add conditional formatting:
In the Paper Design view, right-click the Salary column of data (not the Salary column heading), then choose Conditional Formatting.
In the Conditional Formatting dialog box, click New to create a new Format Exception.
In the Format Exception dialog box, make sure SALARY is selected.
Next to SALARY, choose Greater Than or Equal from the list.
In the next box, type 10000.
Under Format, click the icon next to Text Color to display the color palette.
|
Note: You can choose as many options as you want in the Format Exception dialog box, such as text color, style, and font. |
Click Red.
Click Font, then choose Bold.
Click OK to accept the new font style.
You should now see the following options selected in the Format Exception dialog box:
Click OK.
In the Conditional Formatting dialog box, click New to create your second format exception.
Create a format exception where the values of the SALARY column are between $4999 and $10000 are highlighted in bold.
|
Note: Make sure you type the values in the order described, so that Reports Builder knows to highlight the data between $4999 and $10000, and not $10000 and $4999. |
When you are done, click OK. The Conditional Formatting dialog box should now look like the following:
Figure 23-6 Conditional Formatting dialog box

Click Apply, then click OK. Your report displays in the Paper Design view, and should now look something like this:
Figure 23-7 FInal Conditional Formatting report

Save your report as condhigh_your_initials.rdf.
The steps in this section will show you the PL/SQL code that was automatically generated by Reports Builder when you used the Conditional Formatting dialog box to set up your format exceptions.
|
Note: You can also edit the conditional format trigger code in the PL/SQL Editor, but if you attempt to modify the code again in the Conditional Formatting dialog box, your edits will be overwritten by the selections in the dialog box. If you do modify the code in the PL/SQL Editor, you will see a warning note when you try to open the Conditional Formatting dialog box. |
To examine the automatically generated code:
In the Paper Design view, right-click the Salary column (on which you just applied formatting), then choose PL/SQL Editor.
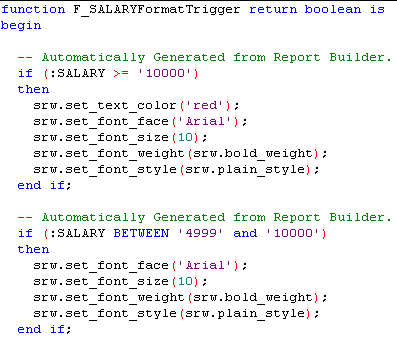
In the PL/SQL Editor, you will see the following code that was automatically generated by Reports Builder.
Figure 23-8 PL/SQL code for the new format triggers

|
Note: In this code, you can see that the two format exceptions you created comprise two parts of a format trigger. You needed to create two separate format exceptions in the Conditional Formatting dialog box to achieve this effect. If you had tried to create both exceptions simultaneously in the same Format Exception dialog box, your data would not have satisfied both exceptions, and thus would not have been highlighted. |
Congratulations! You have successfully built a report that highlights specified data in the report output. You now know how to:
use the Report Wizard to create a simple tabular report.
format the appearance of your report using tools in the Paper Design view.
use the Conditional Formatting dialog box and the Format Exception dialog box to create format triggers that highlight certain data in your report output.
examine the code automatically generated by Reports Builder.
For more information on any of the wizards, views, or properties used in this example, refer to the Oracle Reports online Help, which is available in Reports Builder or hosted on the Oracle Technology Network (OTN), as described in Section 3.1.1, "Using the Oracle Reports online Help".