|
Oracle® Reports Building Reports
10g Release 2 (10.1.2) B13895-01 |
|
 Previous |
 Next |
|
Oracle® Reports Building Reports
10g Release 2 (10.1.2) B13895-01 |
|
 Previous |
 Next |
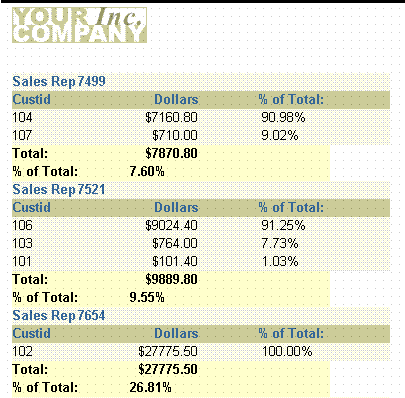
In this chapter, you will learn about summary reports. By following the steps in this chapter, you can generate the report output shown in Figure 9-1.
Concepts
A summary report contains at least one column whose value or values consist of a summary of other data. A column that totals sales, a column that averages a list of commissions, and a column that shows the maximum amounts found in a series of purchase orders are all examples of summary columns.
Data Relationships
The value or values in a summary column are calculated by summarizing data retrieved from another column. Reports Builder provides packaged summary functions you can use to compute the values of summary columns.
By default, the values of a column summarizing data on a record-by-record basis appear in a default report column, as in the preceding example, where % of Total displays as a default tabular column.
The values of a column summarizing data once per set of information (one summary for each break group) appear under the column of values it summarizes.
The result of a column calculating one final result appears once at the bottom of the report.
The difference between a summary column and the columns in previous introductory reports is that you do not select summary columns from the database. You create the summary columns and add them to groups in your report.
To create a summary column, you need to define at least three properties:
Source is the name of the column that contains the data on which the summary column performs its computations. The source column remains unchanged.
Function is the type of summary to be performed. The function tells Reports Builder how to compute summary column values. The functions provided with Reports Builder are Average, Count, First, Last, Maximum, Minimum, % of Total, Standard Deviation, Sum, and Variance. (If none of the Reports Builder summary functions performs the computation you need for your report, you can create your own functions using PL/SQL.)
Reset At is the level or frequency at which the summary columns value returns to zero. The reset level, also known as the reset group, determines when to reset the value of the summary column to zero--in other words, how much of the source column to summarize. You can specify that the summary column summarize all values of the source column for the entire report, you can summarize column values in a break group, or you can summarize column values on a record-by-record basis.
Layout
This report uses a master/detail layout style.
Example Scenario
In this example, you will create a report that displays and summarizes sales data by sales representative. This report includes the following summaries:
The total of all orders from all customers for each sales representative.
The percentage value of each customer's orders in relation to each sales representative's total orders.
The percentage value of each sales representative's orders in relation to the total orders.
The grand total of all orders in the report.
As you build this example report, you will:
Create a data model and a group above layout that includes summaries.
Format fields for monetary values.
Examine the summary column properties (optional) created by the Report Wizard.
To see a sample summary report, open the examples folder named summary, then open the Oracle Reports example called summaryb.rdf. For details on how to access it, see "Accessing the Example Reports" in the Preface.
To build the example in this chapter, you must have access to the Order Entry sample schema provided with the Oracle Database. If you do not know if you have access to this sample schema, contact your database administrator.
When you are creating a single-query report, such as this one, you can use the Report Wizard to create the data model and layout simultaneously.
To create a data model and layout:
Launch Reports Builder (or, if already open, choose File > New > Report).
In the Welcome or New Report dialog box, select Use the Report Wizard, then click OK.
If the Welcome page displays, click Next.
On the Report Type page, select Create Paper Layout Only, then click Next.
On the Style page, type a Title for your report, select Group Above, then click Next.
On the Data Source page, click SQL Query, then click Next.
On the Data page, enter the following SELECT statement in the Data Source definition field:
SELECT SALES_REP_ID, CUSTOMER_ID, SUM(ORDER_TOTAL) TOTAL
FROM ORDERS
GROUP BY SALES_REP_ID, CUSTOMER_ID
|
Note: You can enter this query in any of the following ways:
|
Click Next.
|
Note: If you are not already connected to a database, you will be prompted to connect to the database when you click Query Builder or Next. Ensure that you connect to a database that has the appropriate schema for this example. Section 9.1, "Prerequisites for this example" describes the sample schema requirements for this example. |
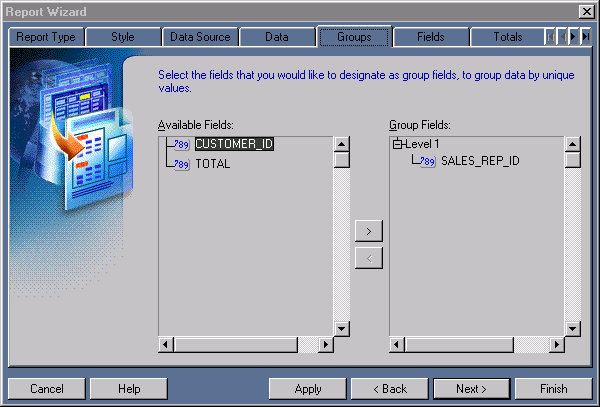
On the Groups page, click SALES_REP_ID and click the right arrow (>) to move this field to the Group Fields list, then click Next.
Figure 9-2 Groups page of the Report Wizard

On the Fields page, click the double right arrows (>>) to move all of the fields to the Displayed Fields list, then click Next.
On the Totals page, click TOTAL in the Available Fields list, then click Sum. Given the data model you are using, this step will create two summary columns for you:
SumTOTALPerSALES_REP_ID sums the total of TOTAL for each value of SALES_REP_ID (that is, for each sales representative).
SumTOTALPerReport sums the total of TOTAL for the entire report (that is, for all sales representatives).
Still on the Totals page, click % of Total. Given the data model you are using, this step will create two columns for you:
TotalTOTALPerCUSTOMER_ID calculates dollars for each customer (CUSTOMER_ID) as a percentage of the total dollars for each sales representative (SALES_REP_ID).
TotalTOTALPerSALES_REP_ID calculates dollars for each sales representative (SALES_REP_ID) as a percentage of the total dollars in the entire report.
Click Next.
On the Labels page, change the labels as follows, then click Next:
| Fields | Labels |
|---|---|
| SALES_REP_ID | Sales Rep
|
| CUSTOMER_ID | Customer
|
| TOTAL | Dollars |
On the Template page, make sure Beige is selected under Predefined Template.
Click Finish to display your report output in the Paper Design view.
In the Paper Design view, notice the Total field. The values are neither aligned nor displayed as monetary amounts. You can quickly rectify this in the Paper Design view.
To assign a format mask to monetary values:
In the Paper Design view, select the first number value underneath the Dollars label. Notice that all of the values are immediately selected, indicating that you can change their properties simultaneously.
|
Tip: If you are familiar with format mask syntax, you could now right-click the field values, choose Property Inspector, and choose or manually enter a value for the Format Mask property. |
Click the Currency button in the toolbar. A currency symbol immediately appears next to all of the values.
Click the Add Decimal Place button twice. Two decimal places are added to the right of the decimal point.
Resize the field by clicking and dragging the rightmost handle of the field approximately 0.5 inches (1.5 centimeters) to the left.
Click the Align Right button. All of the values are immediately right aligned.
Select the Dollars label itself.
Click the Align Right button.
Select the number value to the right of the Total: label.
Click the Currency button. A currency symbol immediately appears next to all of the values.
Click the Add Decimal Place button twice. Two decimal places are added to the right of the decimal point.
Click the Align Right button. All of the values are immediately right aligned.
Figure 9-4 Summary report output with monetary values formatted

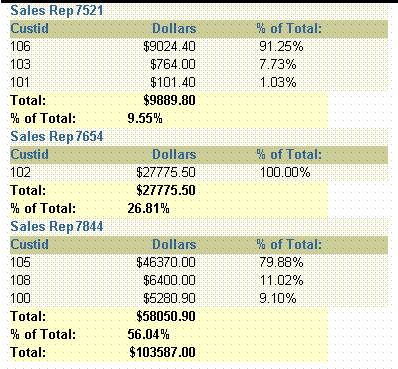
Go to the end of the report. The last value on the last page should be a summary labelled Total:, which sums the values of TOTAL across the entire report.
Select the unformatted number to the right of the Total: label.
Click and drag this field until its right edge is aligned with the right edge of the values in the Total column.
Click the Currency button in the toolbar. A currency symbol immediately appears next to the Total value.
Click the Add Decimal Place button twice. Two decimal places are added to the right of the decimal point.
Click the Align Right button. All of the values are immediately right aligned.
Save the report as summaryb_your_initials.rdf.
Figure 9-5 Summary report with report total formatted

In this case, the Report Wizard created the summaries according to the requirements of the project. However, in some cases, you may need to manually adjust the settings of summaries to get the exact calculations you wish. By carefully reviewing the summaries created by the Report Wizard, you can gain a better understanding of how summaries work.
In this section, you will not be making any changes to the report, you will only be checking the summary settings to better understand summaries.
Reviewing summary settings
In the Paper Design view, select the percentage value to the right of the % of Total label.
Double-click the values to display the Property Inspector.
In the Property Inspector, notice the Source property, which indicates the column that is the source of the field.
Repeat steps 1 through 3 for all of the summaries in the report. Note down the name of the columns that are the sources for each of these summary fields.
In the Object Navigator, double-click the view icon next to the Data Model node to display the Data Model view.
In the Data Model view, double-click TotalTOTALPerSALES_REP_ID in group G_SALES_REP_ID to display the Property Inspector.
In the Property Inspector, notice the values of the properties under Summary:
Function is % of Total. Change % of Total to Sum. Note that the Compute At property disappears because it is unnecessary for a Sum calculation. Change Function back to % of Total and Compute At reappears.
Source is the TOTAL column, which means that TOTAL is used to compute the summary.
Reset At is G_SALES_REP_ID. The value of TotalTOTALPerREPID will reset to zero after each record in G_SALES_REP_ID (that is, for each sales representative).
Compute At is Report. A compute level of Report means that the TotalTOTALPerSALES_REP_ID column will base its percentages on the sum of all of the TOTAL in the entire report.
Repeat steps 6 and 7 for each of the summaries in the data model. Notice the differences in the properties for each of the summaries.
It can also be a useful exercise to return to the Paper Design view and see where fields that correspond to the summaries are placed in the layout. For example, the field that corresponds to TotalTOTALPerSALES_REP_ID is placed inside the master repeating frame, R_G_SALES_REP_ID, but outside of the detail repeating frame, R_G_CUSTOMER_ID.
Congratulations! You have successfully created a summary report. You now know how to:
create a data model with summaries and lay out the data with the Report Wizard.
format fields in the Paper Design view.
examine the summaries and their properties.
For more information on any of the wizards, views, or properties used in this example, refer to the Oracle Reports online Help, which is available in Reports Builder or hosted on the Oracle Technology Network (OTN), as described in Section 3.1.1, "Using the Oracle Reports online Help".