|
Oracle® BPEL Process Manager Developer's Guide
10g Release 2 (10.1.2) B14448-02 |
|
 Previous |
 Next |
|
Oracle® BPEL Process Manager Developer's Guide
10g Release 2 (10.1.2) B14448-02 |
|
 Previous |
 Next |
This chapter provides an overview of Oracle BPEL Console reports. It provides descriptions of the types of reports you can create, how to create them, and how to analyze the results.
This chapter contains the following topics:
You can create reports in Oracle BPEL Console that enable you to:
Receive an overall view of business process instance performance
Analyze data for the BPEL process instances and make critical decisions
Analyze data of the activities that constitute a business process
Identify and debug faults and take appropriate corrective actions
Perform the following steps to create reports. The examples shown in this section describe how to create reports for the LoanFlowPlus sample BPEL process that is available under the Oracle_Home\integration\orabpel\samples\demos\LoanDemoPlus\LoanFlowPlus directory. To automatically build this sample in JDeveloper BPEL Designer, create a workspace with an empty project and click the LoanFlowPlus.jpr file in the LoanFlowPlus directory.
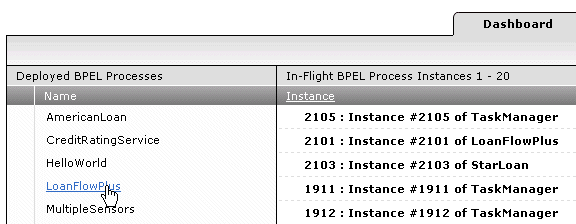
Click a specific process to create reports for all its instances in the Deployed BPEL Processes column of the Dashboard tab of Oracle BPEL Console (for this example, LoanFlowPlus is selected).
The Initiate tab appears by default.
Enter specific details to initiate an instance and click Post XML Message.
Click Reports on the BPEL Processes tab.

The Reports tab appears:

This page enables you to generate several report types. The fields to complete in order to create reports are described in the following table:
For example, if you enter 7/29/05 as the end date, 22:00 as the end hour, Weekly as the time interval, and 3 as the number of time intervals, the report is created for the three weeks between 7/08/05 at 10 PM and 7/29/05 at 10 PM.
See the following sections for details about creating the available report types:
|
Notes:
|
Process reports display data on the state of selected BPEL process instances and execution times of these instances. The data is grouped along the time line (X-Axis) into the number of time intervals based on the specified query criteria.
Select Process from the Report Type list.
Enter appropriate time period query details as described in the table in Step 3 and click Go.
The report results appear:
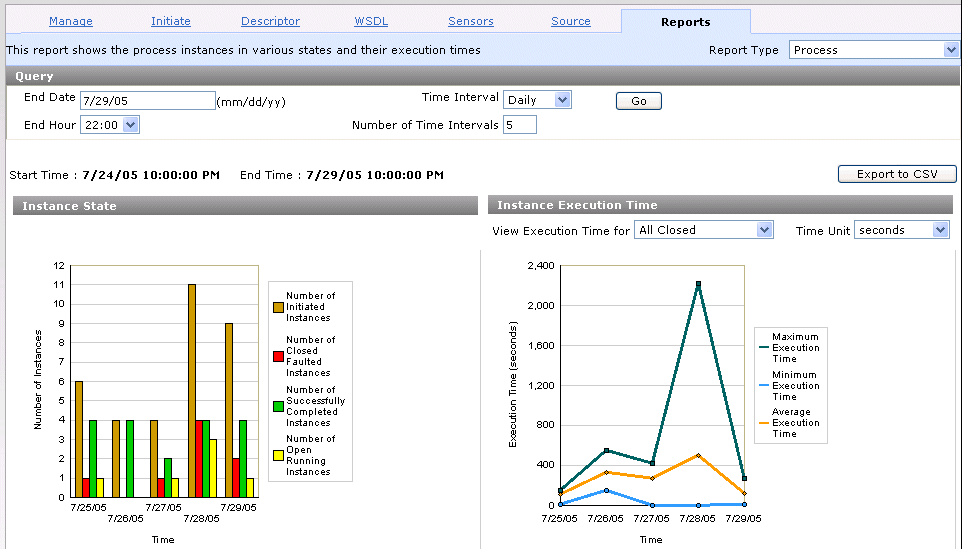
Review the Instance State section of the process report (the left side).
The graph shows the number of BPEL process instances initiated, faulted, successfully completed, and currently running. For this example, which uses the LoanFlowPlus sample BPEL process, the graph shows how many loans were requested (initiated), how many stopped abnormally due to faults in the system, how many were successfully processed, and how many are still pending.
Hold your cursor over a specific bar to display information. For this example, the information that displays identifies the series as faulted instances, the group (date) in which this information was gathered as 7/28/05, and the value (number) of faulted instances as four.
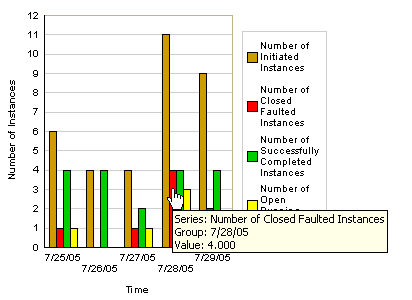
Click this bar to display the list of instances that faulted.
This displays the list of four faulted instances on the Instances tab.

Click a specific instance from the list to debug.
You can then debug the instance and take appropriate corrective actions.
Return to the process report results shown in Step 2.
Review the Instance Execution Time section of the process report (the right side).
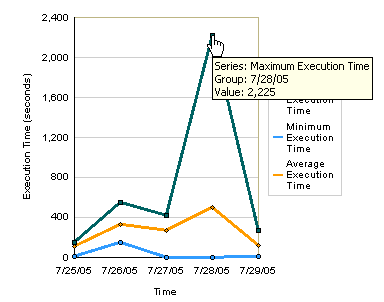
This graph shows the maximum, minimum, and average execution times aggregated across all closed instances of the business process during the selected time interval. By default, process reports display all successfully and unsuccessfully completed processes (known as All Closed).
If you want to display only successfully completed (known as Closed Successfully) or unsuccessfully completed (known as Faulted) process instances, make an appropriate selection from the View Execution Time for list above the graph.
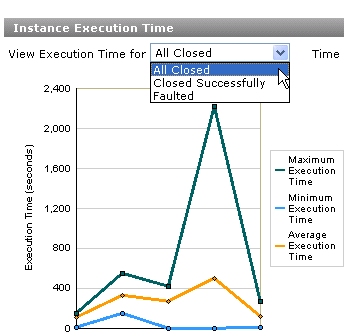
Click one of the minimum or maximum data points in the graph to show additional details. For example, click the maximum execution time to view information about the instance that took the longest amount of time to execute.
This displays the Instances tab for this instance.

Click the specific instance in the list.
You can then debug the instance and take appropriate corrective actions.
Performance reports display the percentage of BPEL process instances that meet the Completion Time SLA field value. This enables you to identify bottlenecks in instance performance. You assign this value to the SLACompletionTime parameter in the Configurations tab of the Deployment Descriptor Properties window in JDeveloper BPEL Designer. You specify an SLACompletionTime parameter value using the P0YT format. P0YT conforms to the PnYnMnDTnHnMnS convention, where:
T is the date and time separator
nY, nM, nD, nH, nM, and nS correspond to the number of years, months, days, hours, minutes, and seconds, respectively
For example, P0YT1.5S corresponds to 0 years, 1.5 seconds. The letter P and at least one unit of time must always be present.
If you define the completion time service level agreement (SLA) value for the LoanFlowPlus process as P0YT450S seconds (450 seconds), the report graph shows the percentage of instances that completed and did not complete within that time period.
This assignment adds this parameter to the bpel.xml file.
<configurations>
    <property name="SLACompletionTime">P0YT450S</property>
</configurations>
Select Performance from the Report Type list.
Enter appropriate time period query details as described in the table in Step 3 and click Go.
The report results appear:
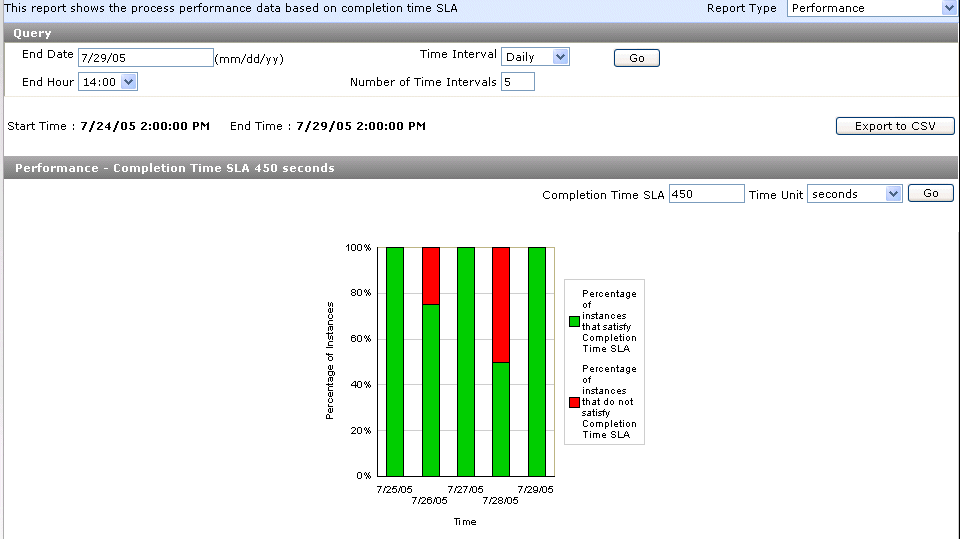
This graph shows the percentage of instances that completed and did not complete within this time period.
Hold your cursor over a specific bar to display information. For this example, the information that displays below identifies the series of instances that satisfied the SLACompletionTime parameter value, the group (date) in which this information was gathered as 7/29/05, and information about the percentage and number of successfully completed instances and total number of instances for that day.
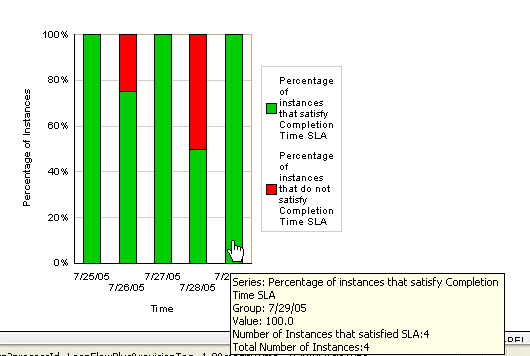
Click a specific bar to display the Instances tab. For example, click the red bar for instances that did not satisfy the SLA value. Holding your cursor over this bar before clicking displays specific information about these instances.
Click the specific instance in the list.
You can then debug the instance and take appropriate corrective actions.
If you want to override the SLACompletionTime parameter value in the bpel.xml file, change the value in the Completion Time SLA field above the graph and click Go to re-execute the report.
The report results display details based on the new parameter value entered. Note that a Default link now displays to the right of the value you entered in Step 6.

Click Default to re-execute the report with the initial SLACompletionTime parameter value set during design time in the Configurations tab of the Deployment Descriptor Properties window.
Activity sensor reports show data for the activity sensors associated with the selected BPEL process over a specified time span. This enables you to analyze activity trends. Activity sensor reports show the activity name, sensor name, activity type, aggregated values of the minimum, maximum, and average execution time of the activity, and the number of occurrences of the activity. This report shows activity execution time only if activity sensors are defined for the BPEL process.
Select Activity Sensor from the Report Type list.
Enter appropriate time period query details as described in the table in Step 3.
Make a selection from the Activity Sensor list. Only activities with sensors display in this list.
Select All to create a report for all activities in the BPEL process.
Select a specific activity for which to create a report.
Click Go.
The report results appear (for this example, All was selected from the Activity Sensor list):
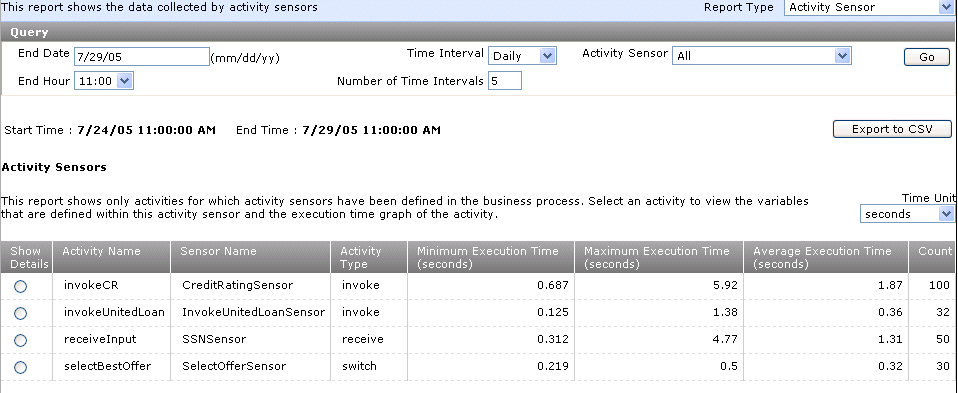
Click Show Details on the far left side to view additional information about an activity sensor.
This displays details about all the variables associated with that activity sensor. It also shows a graph for the minimum, maximum, and average execution times, as collected by the chosen activity sensor over the selected time span.
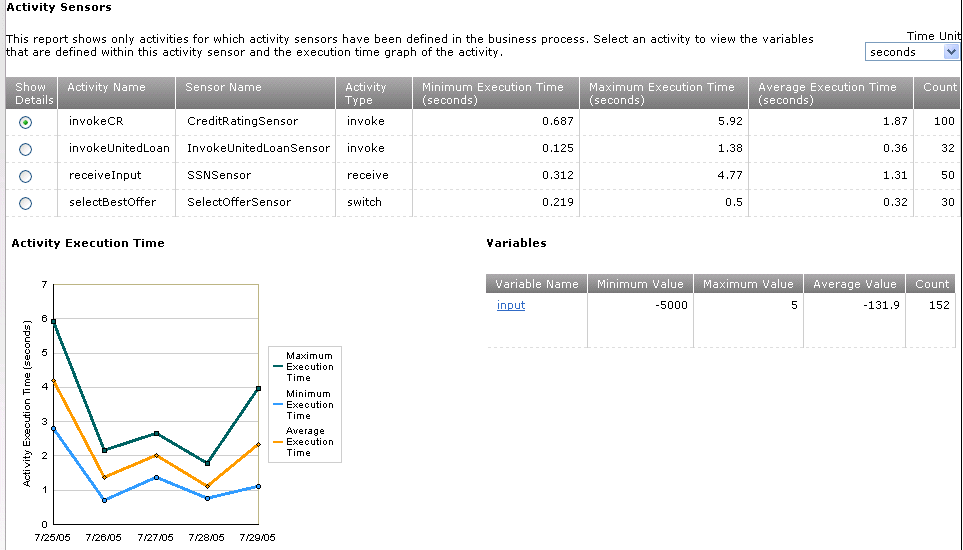
Click the variable name in the Variable Name column (for this example, named input) to display the detailed values of the variable collected during the selected time period.
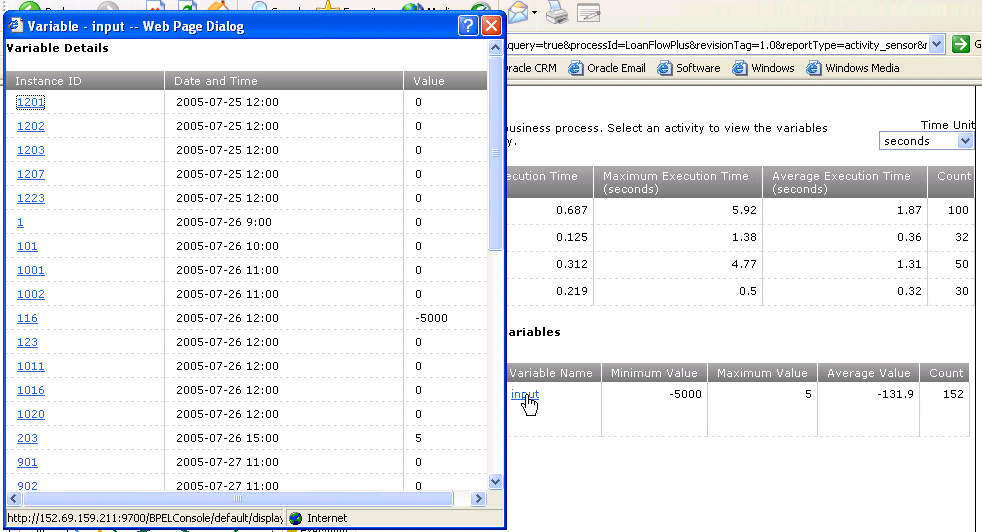
Click a specific instance ID on the Variable Details window to display the Flow diagram of that instance.
You can then debug the instance and take appropriate corrective actions.
Fault sensor reports show the data collected by fault sensors over a specified time interval. This enables you to analyze trends in faults while processing loan applications. The report shows the date and time of the fault occurrence, the activity in which the fault occurred, and a link to the faulted instance. For this example, the LoanFlowPlus sample BPEL process is used. There are two types of faults for which data is provided in this sample:
Bankruptcy reports — the fault occurs when the customer has a negative credit rating
The social security number of the customer requesting the loan was not found
Select Fault Sensor from the Report Type list.
Enter appropriate time period query details as described in the table in Step 3 and click Go.
The report results display the types of fault messages.
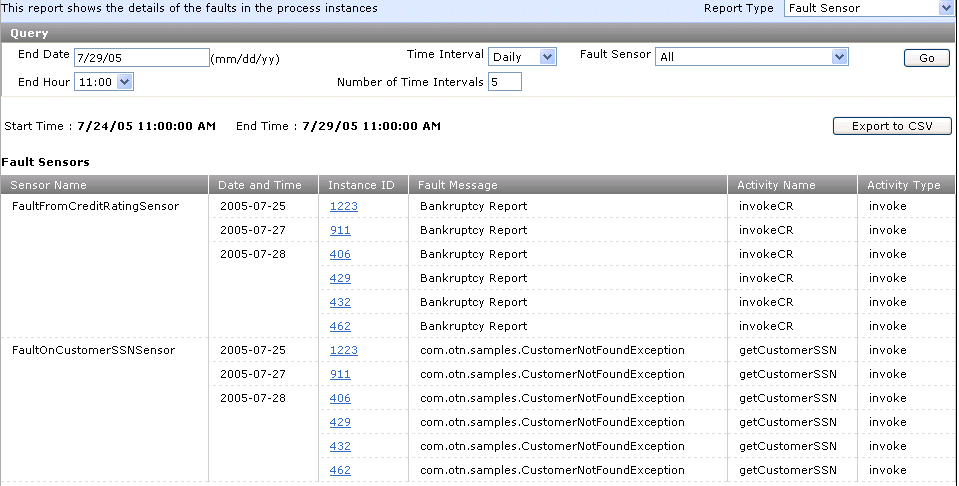
Click a specific instance ID in the Instance ID column to display the Flow diagram for the activity of the instance that faulted.
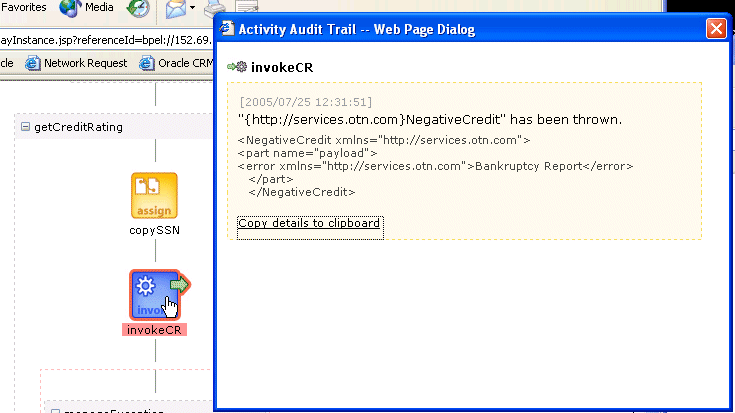
Debug the activity and take appropriate corrective actions.
Process time distribution reports enable you to view the distribution of execution times across the activities of BPEL process instances. For example, you may have two activities, one for each loan application company returning a loan offer. You can see which activity is taking the longest amount of time to process the loan offer. You do not need to create sensors in activities to use this report. This report enables you to identify which activities are taking the most time to process.
Select Process Time Distribution from the Report Type list.
Enter appropriate time period query details as described in the table in Step 3 and click Go.
The report results appear:
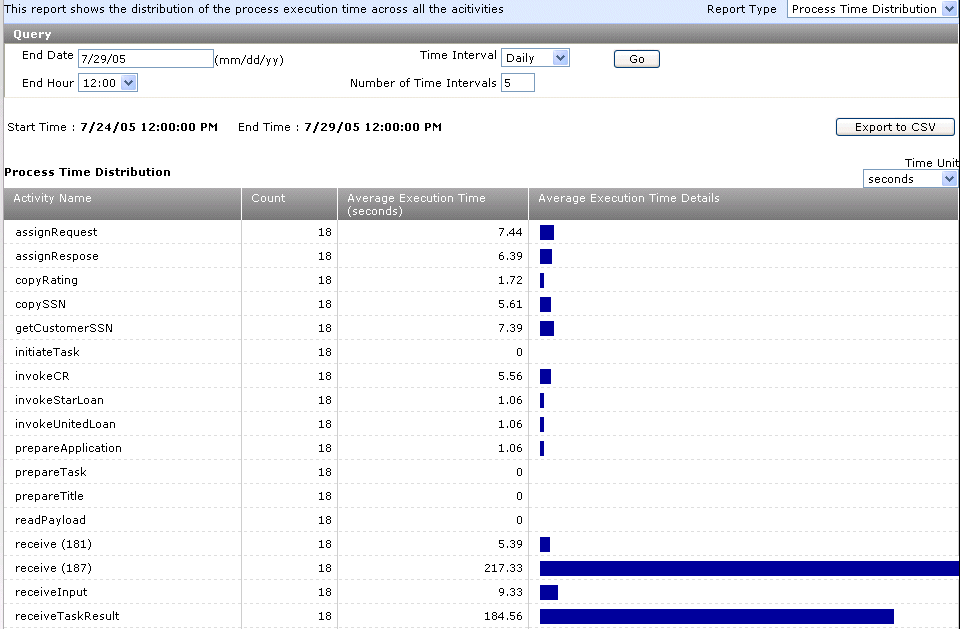
Note which activities take the longest to complete.
Debug the activity and take appropriate corrective actions.