|
Oracle® BPEL Process Analytics User's Guide
10g Release 2 (10.1.2) Part No. B15597-01 |
|
 Previous |
 Next |
|
Oracle® BPEL Process Analytics User's Guide
10g Release 2 (10.1.2) Part No. B15597-01 |
|
 Previous |
 Next |
Oracle BPEL Process Analytics generates real-time data, but it also archives data as tables for future analysis. This analysis is performed with Oracle Business Intelligence Discoverer.
This chapter includes the following topics:
Oracle BPEL Process Analytics not only provides real-time analysis on incoming data, it also archives this data for later examination. This information is stored in a star join schema composed of fact and dimension tables.
Oracle Business Intelligence Discoverer locates the archived information and presents it through an end user layer (EUL), which simplifies working with the database for the user. This chapter assumes that the user is already familiar with Discoverer and is focused on using Discoverer to analyze archived BPA data.
Once you have created your EUL, define business areas, folders, and items in Discoverer to access only the data you want to analyze.
|
See Also: ÒCreating and Maintaining the EULÓ in Oracle Business Intelligence Discoverer Administration Guide for additional information on the EUL |
Oracle BPEL Process Analytics uses a number of data structures to record the data in tables arranged in a star join schema. These components include composite events, Key Performance Indicators (KPIs), facts and dimensions, item classes, tables, and the star join schema itself. Most of these items have been defined previously in this guide, but are reviewed in the following sections. Item classes and business areas (along with the EUL) are discussed in detail in the Oracle Business Intelligence Discoverer Administration Guide.
A composite event can include one or more events, from one event source only. Events are correlated on the basis of a common event attribute (referred to as a correlation attribute).
|
See Also: "Modeling Composite Events and Composite Event Groups" for additional information on composite events |
A key performance indicator (KPI) consists of instances of a composite event attribute (or attributes) aggregated over a period of time, to which a mathematical function is applied. While metrics can be used to study general patterns and trends, KPIs enable an analyst to perform in-depth analysis of the event data.
In online analytical processing (OLAP) metadata, facts are data that can be examined and analyzed in crosstabs and graphs.
Facts have dimensions that categorize the data in the fact. For example, a sales fact might have product, time, and geography as its dimensions. When a fact has a particular dimension, the fact is said to be dimensioned by that dimension. For example, sales is dimensioned by product. The group of dimensions for a fact constitute the dimensionality of that fact. For example, the dimensionality of Sales is product, time, and geography. Each element in a dimension is a dimension member. For example, January 2005, February 2005, March 2005, Quarter 1 2005, and the year 2005 are likely members of the time dimension.Facts can have more than three dimensions.
An item class is a list of values for dimensions, which associate Oracle BPEL Process Analytics data with Discoverer table entries and provide names.
|
See Also: For more information about how to create custom folders and item classes, see Oracle Business Intelligence Discoverer Administration Guide |
In a relational data source, data is organized in tables. A table is a data structure with columns and rows. The tables are created by Oracle BPEL Process Analytics. In the star join schema that BPA uses to store information, there are fact tables and dimension tables. Multiple dimension tables are joined with each fact table.
A fact table typically contains fields that are additive and represent measurements whose values change each time they are taken. For example, the number of loans offered, number of loans rejected, and loan amounts.
A dimension table typically contains a single primary key and, optionally, additional columns whose values are stable over time, such as a car's make, model, and year.
The time dimension is a specific kind of dimension that is always created and associated with each fact table. The time dimension is not user defined.
The time dimension is defined as shown in Table 9-1.
Table 9-1 The Time Dimension Table Structure
| Name | Null? | Type |
|---|---|---|
TIMEID
|
NOT NULL | NUMBER
|
HOUR
|
|
CHAR(10)
|
DAY
|
|
CHAR(8)
|
MONTH
|
|
CHAR(6)
|
QUARTER
|
|
CHAR(5)
|
YEAR
|
|
CHAR(4)
|
The time dimension is joined with Oracle BPEL Process Analytics fact tables to calculate KPI values for pre-defined time periods. Table 9-2 is a sample row from the time dimension table bam_dim_time_t.
Table 9-2 bam_dim_time_t Sample Row
| TIMEID | HOUR | DAY | MONTH | QUARTER | YEAR |
|---|---|---|---|---|---|
2005010101
|
2005010101
|
20050101
|
200501
|
20051
|
2005
|
The year column represents the four-digit year. The quarter column represents the quarter of the year using a four-digit year and 1 to 4 representing the four quarters of the year. The month column contains the month of the year using the four-digit year and a two-digit, zero-filled month (01 - 12). The day column has the format of YYYYMMDD where day is the day of month (also zero-filled). The Hour column has the format YYYYMMDDHH where hour is zero-filled hour of day (00 - 23). The values in the TimeID column are numeric and are used to join with Oracle BPEL Process Analytics fact tables. The only requirement for the TimeID is that it be a unique value. However, a convenient unique key for each row in the time dimension is identical to the Hour column.
The modeling of KPIs and dimensions is based on the concept of a star join schema. A star join schema, commonly used for dimensional data warehouses, is composed of a fact table that is joined by primary keys to a number of dimension tables. A fact table typically contains fields that are additive and represent measurements whose values change each time they are taken. A dimension table typically contains a single primary key and, optionally, additional columns whose values are stable over time.
The star join schema contains a fact value for each possible combination of the different dimensions. It is therefore very quick for applications such as Discoverer Plus OLAP to find the value for sales of a particular product in a particular city in a particular year.
For example, to find sales of Product C in 2005 in Dallas, Discoverer Plus OLAP simply uses the product, time, and city dimensions to identify the cell containing the required value.
A business area is a collection of related information in the database. The Discoverer manager locates the information in the database and groups it into business areas. Within each business area, the Discoverer manager organizes information into folders.For example, the key areas of a company's business might be sales, production, and human resources. Therefore, the Discoverer manager creates three corresponding business areas.
|
See Also: Creating and Maintaining Business Areas in the Oracle Business Intelligence Discoverer Administration Guide for additional information creating business areas in Discoverer. |
The LoanFlowPlus example in the Oracle BPEL Process Analytics Quick Start Guide is a good example of how Oracle BPEL Process Analytics creates a star join schema that can be analyzed using Discoverer.
Log into the Oracle BPEL Process Analytics Admin Console. The following welcome page appears:
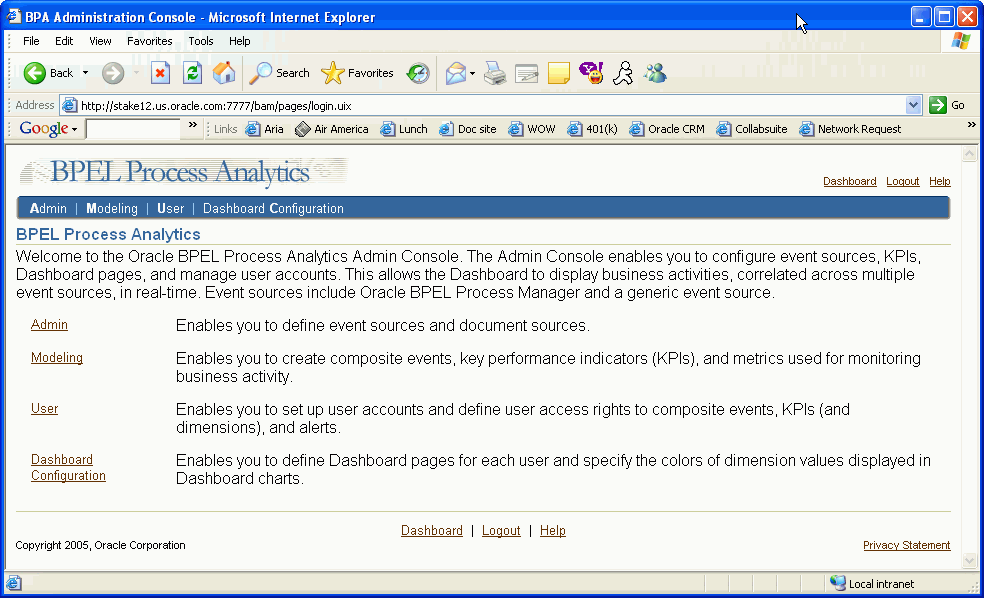
Select Modeling, either by clicking the link or by clicking Modeling on the menu bar.
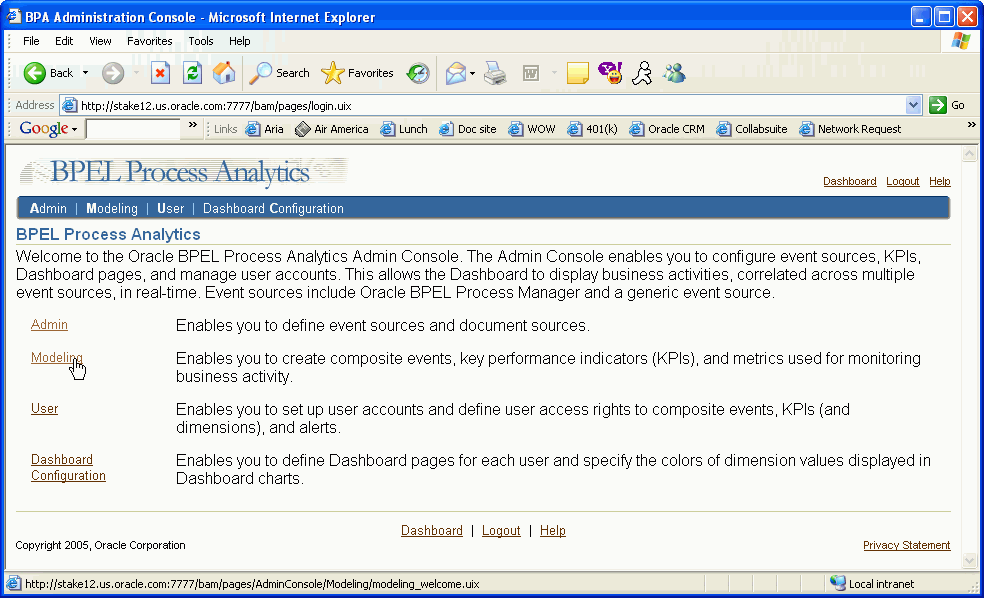
Description of the illustration bpa2a.gif
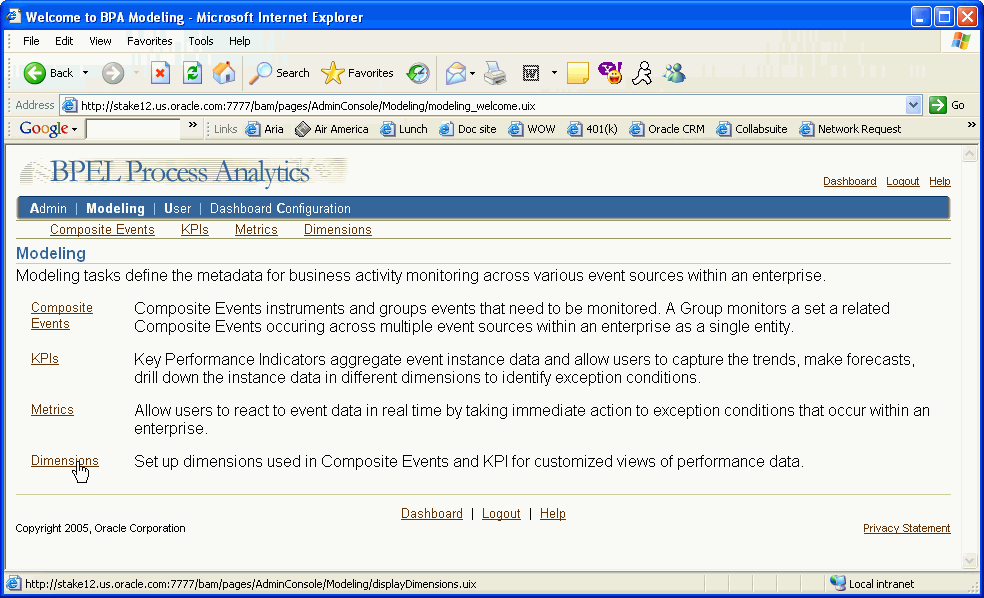
The Modeling page appears. The first task demonstrated is defining dimensions. Click the Dimensions link.
The Dimensions page displays the current dimensions, and a Create button to define new dimensions. While the LoanFlowPlus tutorial already comes with a full set of dimensions and KPIs, the following pages demonstrate how to define a new dimension.
Click the Create button.

Description of the illustration bpa4a.gif
The following Dimension:Name page appears:
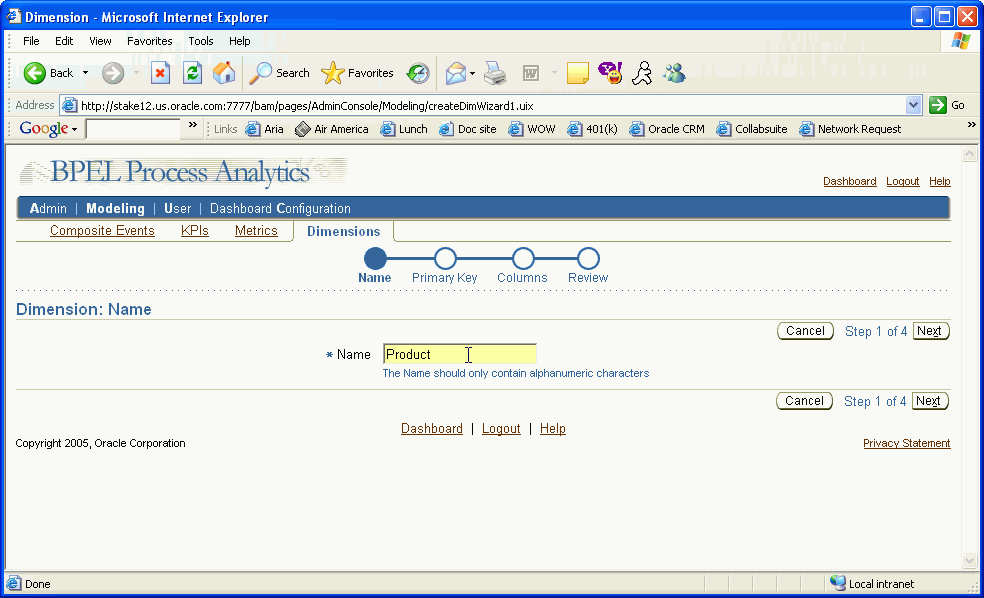
Enter the dimension name and click Next.
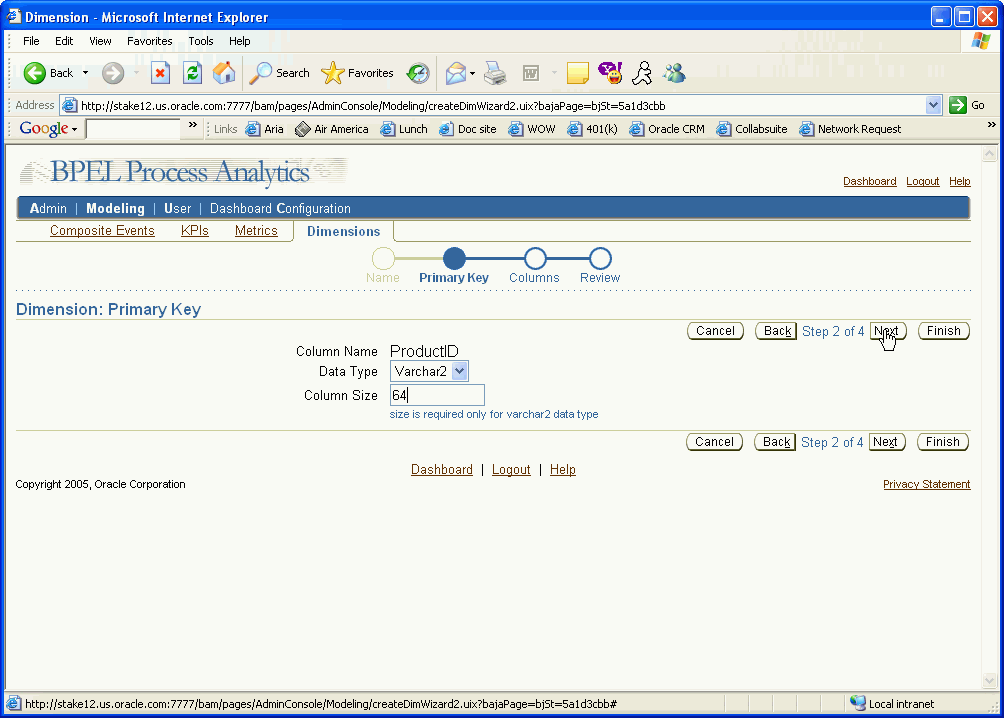
Select the data type for the dimension key column from the data type box. The possible choices are:
Integer
Number
Varchar2
For Varchar2, you must also enter a column size.
Click Next.
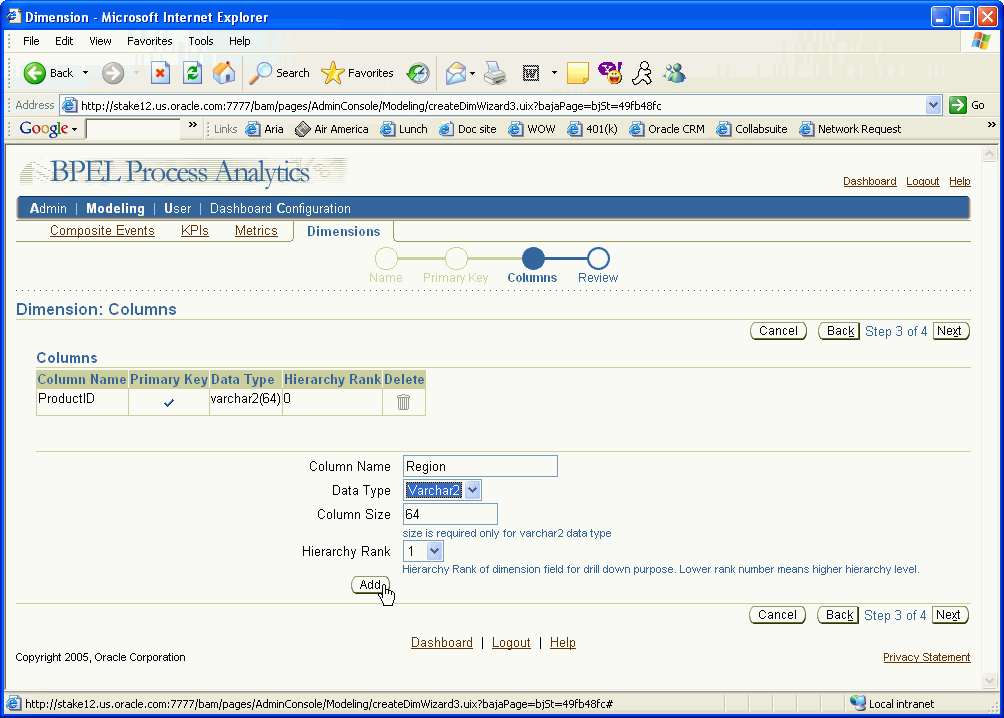
You may also add additional columns with different hierarchy ranks into the dimension. To add a new column, do the following:
Enter the Column Name, Data Type, and Column Size (if the data type is varchar2).
Click Add.
Repeat the previous steps to add addition columns.
Once you have added all the columns to the dimension, click Next.
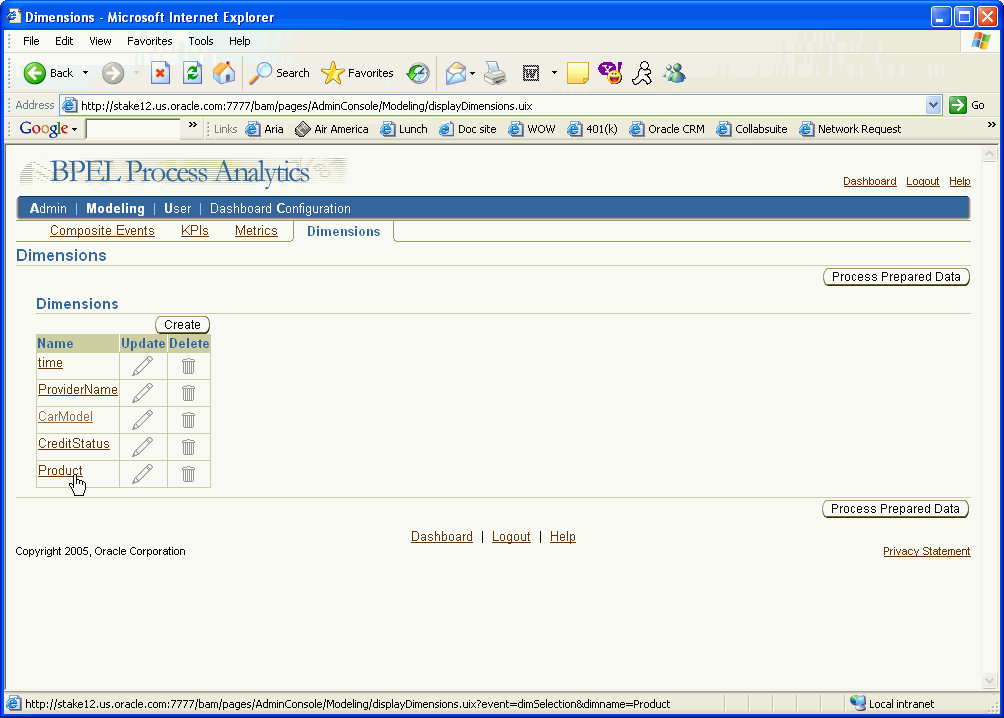
The Dimensions page appears again, now with the new dimension listed.
The next task is to define KPIs. Again, LoanFlowPlus comes with a full set of KPIs. The following demonstrates how to add additional KPIs.
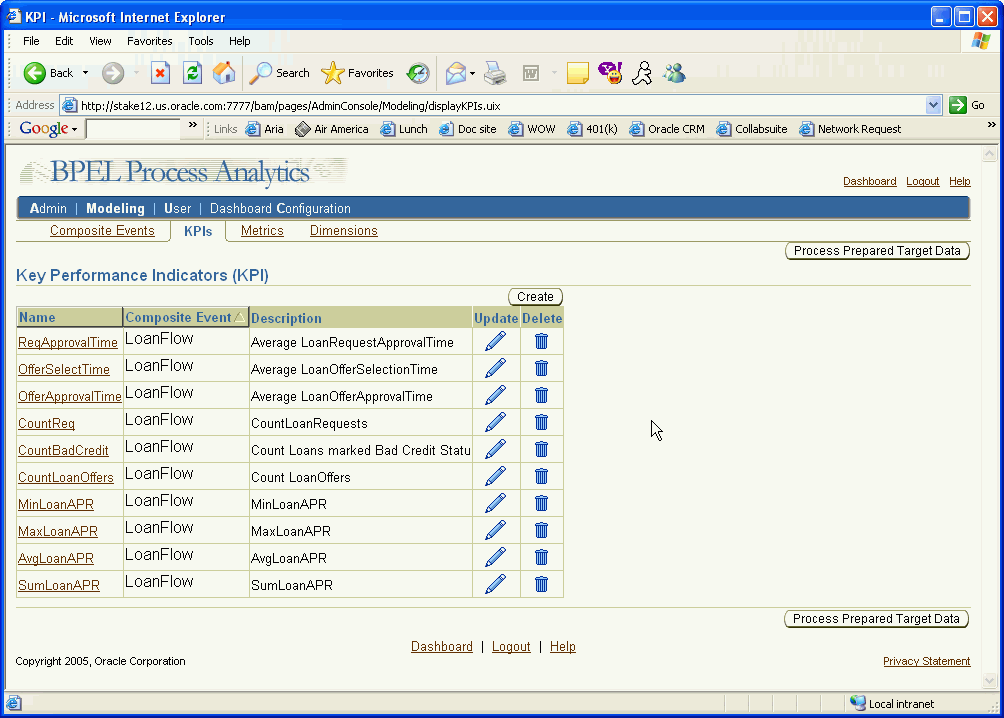
Description of the illustration kpi1.gif
Click the Create button. The KPI:Name page appears:

Enter the KPI name and description, and select the aggregation and the value type.
Click Next.
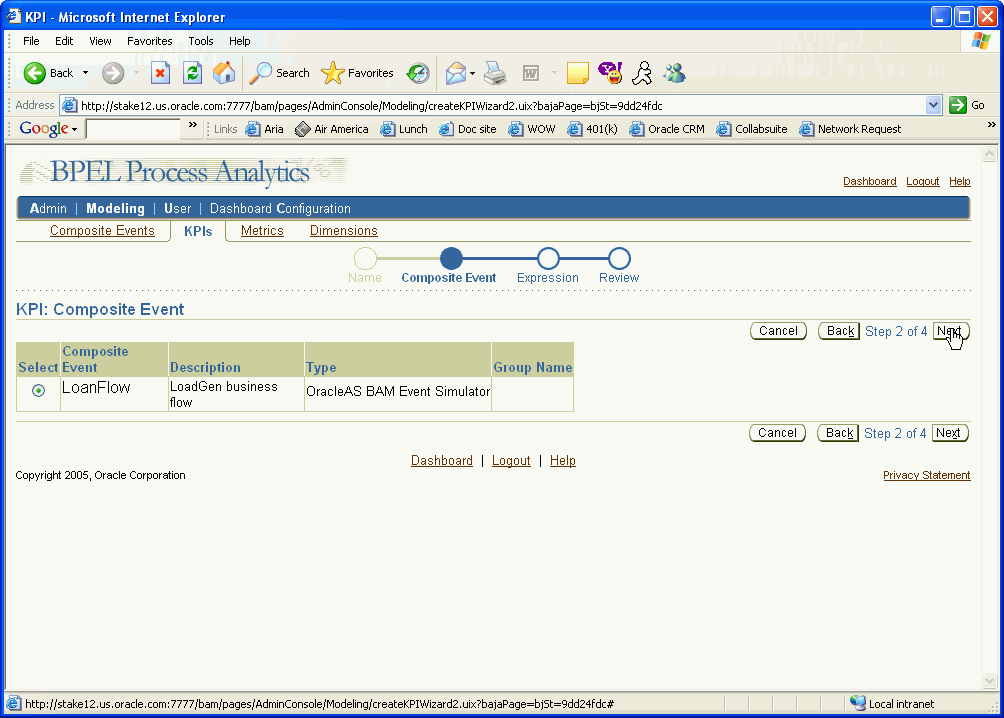
The Composite Events page lists the current composite events.
Map the event attributes to the KPI by selecting the composite event.
Click Next.
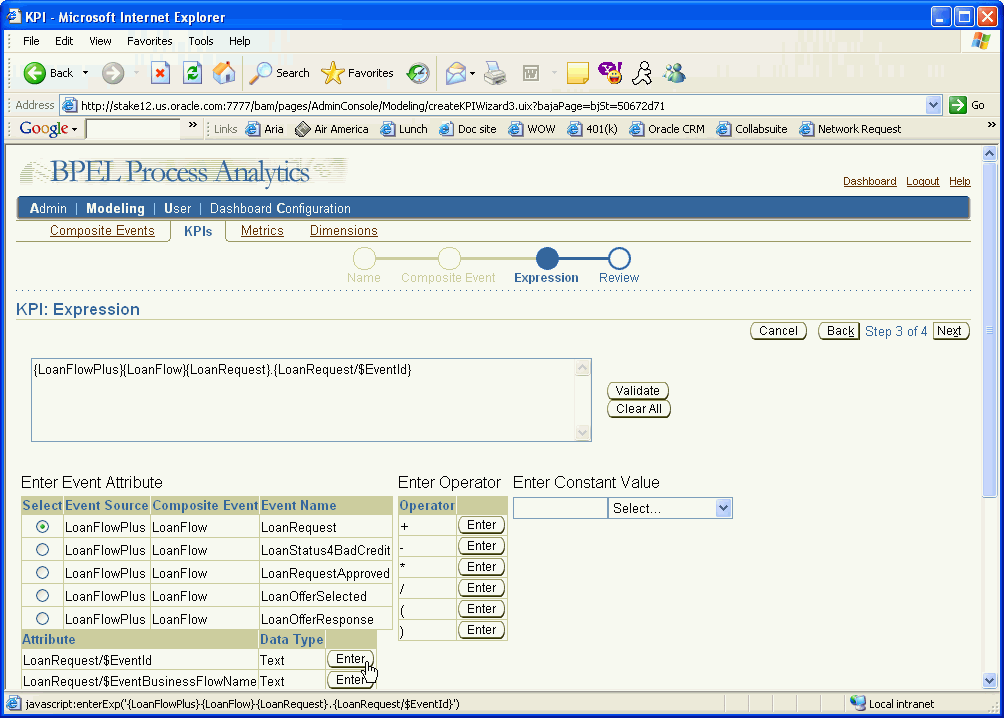
Compose the KPI expression by selecting the event name, attribute, operators, constants, and values.
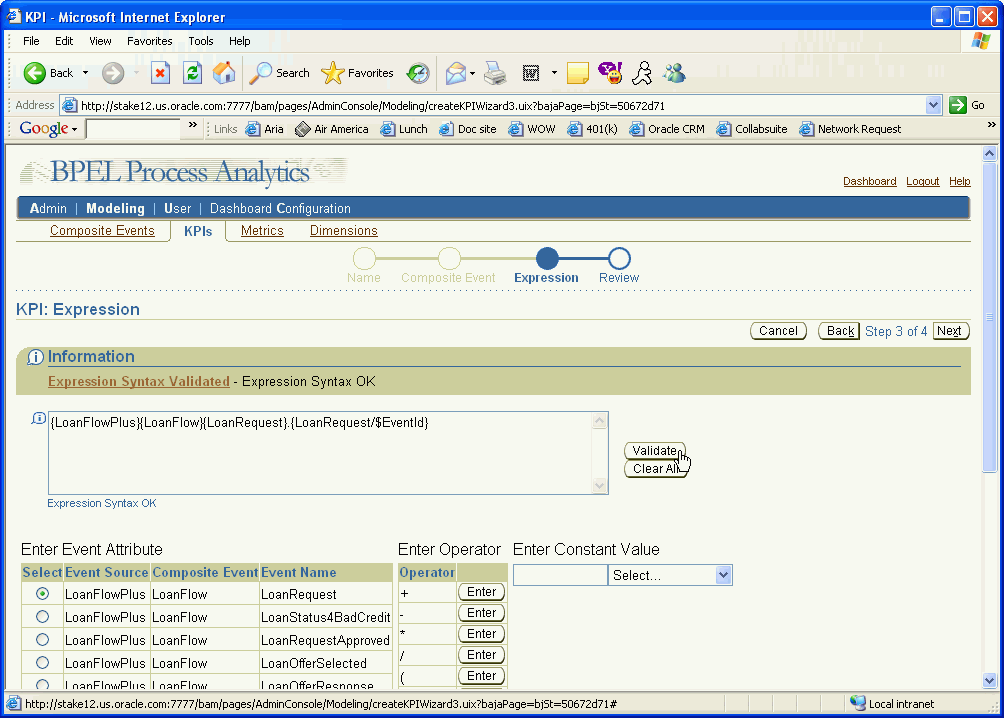
Once the expression is complete, you may validate it by clicking the Validate button. A successful validation displays the following confirmation:
Click Next.
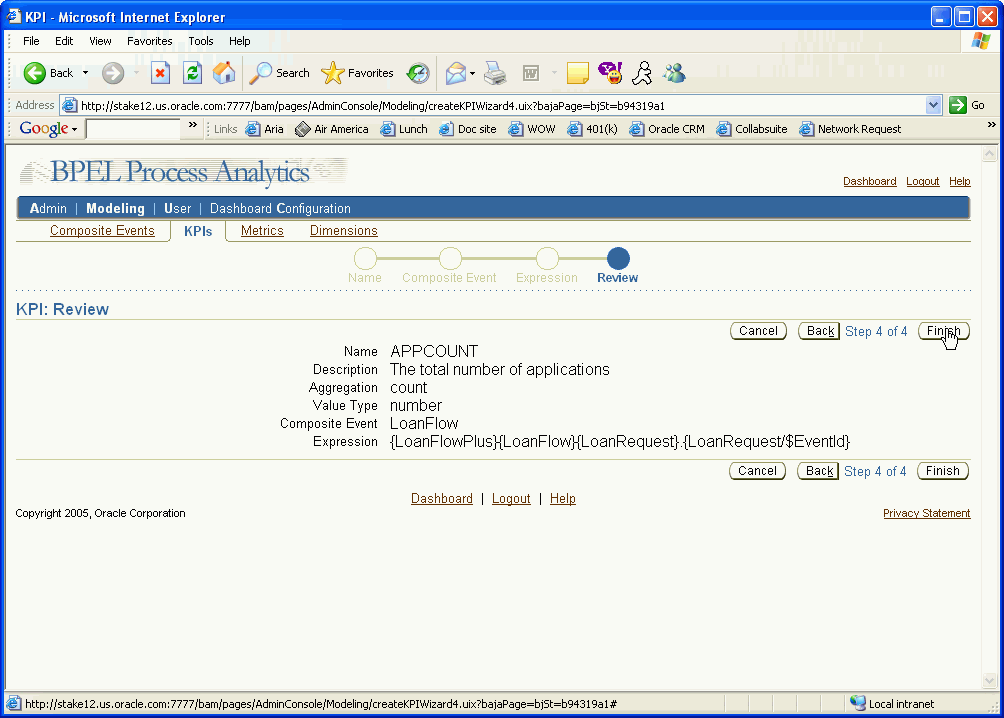
Review the KPI information. Click Back to make changes, or Finish if the information is complete.
The list of KPIs appears again, including the KPI you just defined:
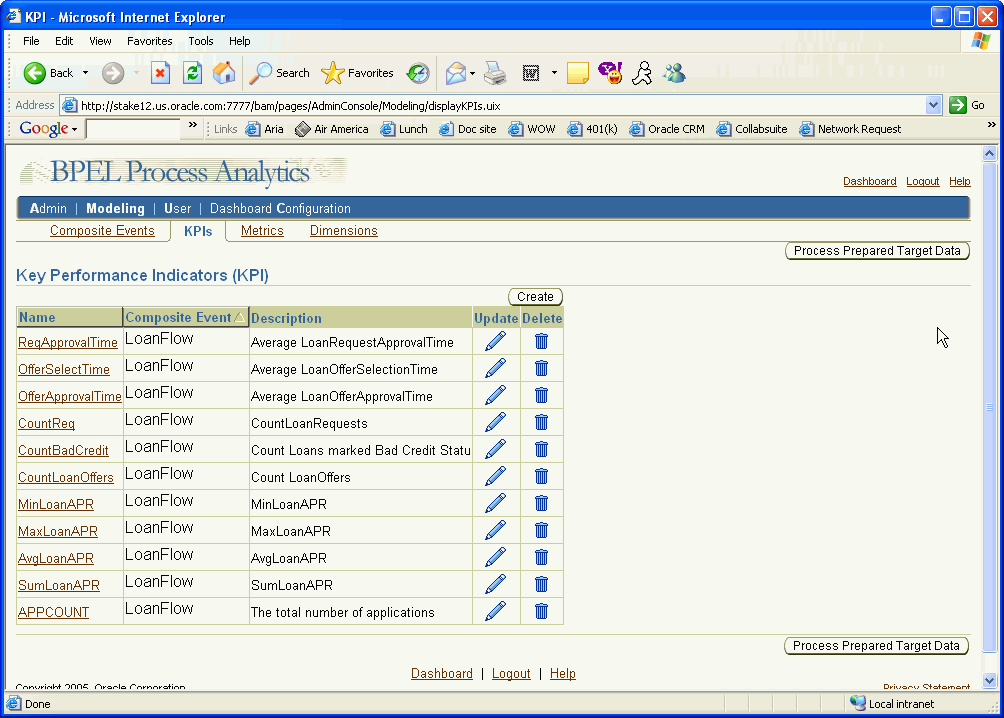
Click the User tab to begin assigning KPIs to a user.
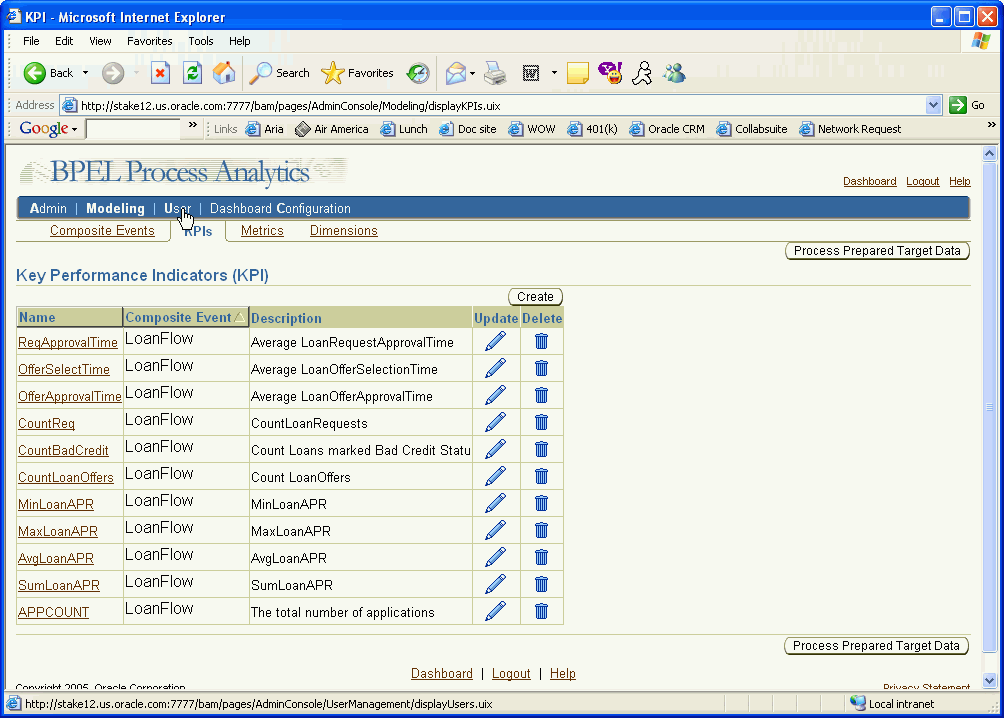
A list of current users appears. You may also add new users by clicking the Create button. The following example demonstrates how to add KPIs to an existing user.

Select the pencil icon (update) in the Administrator row.

Select the KPIs tab.
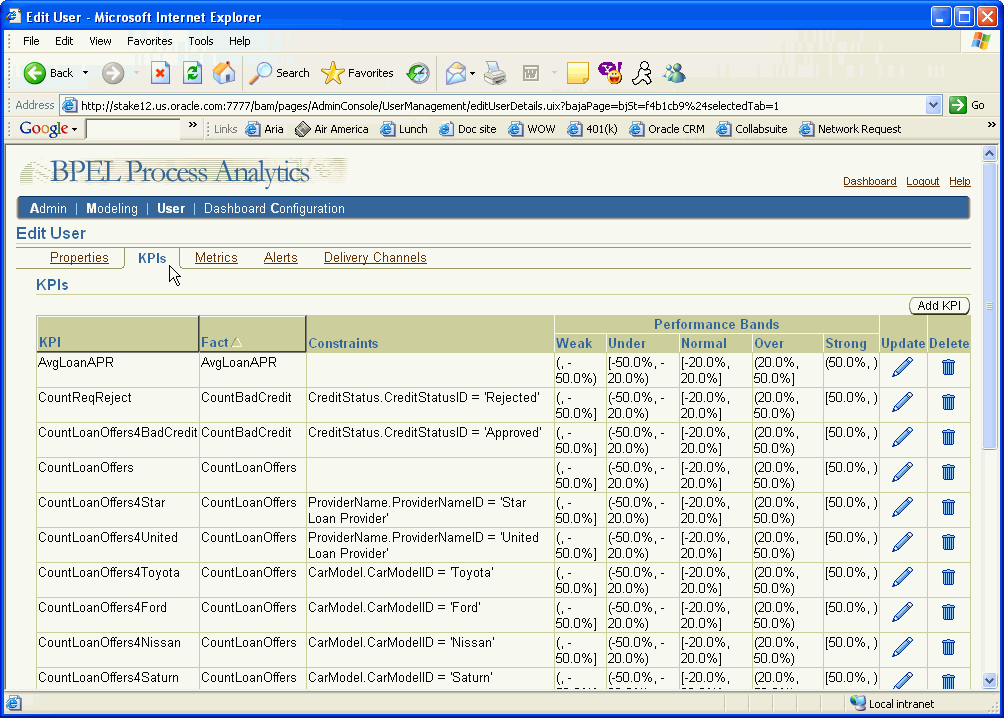
A list of the current KPIs appears.
Add a new KPI by clicking on the Create button. The following example demonstrates how to add a KPI to that user's list.

Select the KPI from the KPI box. Click Next.
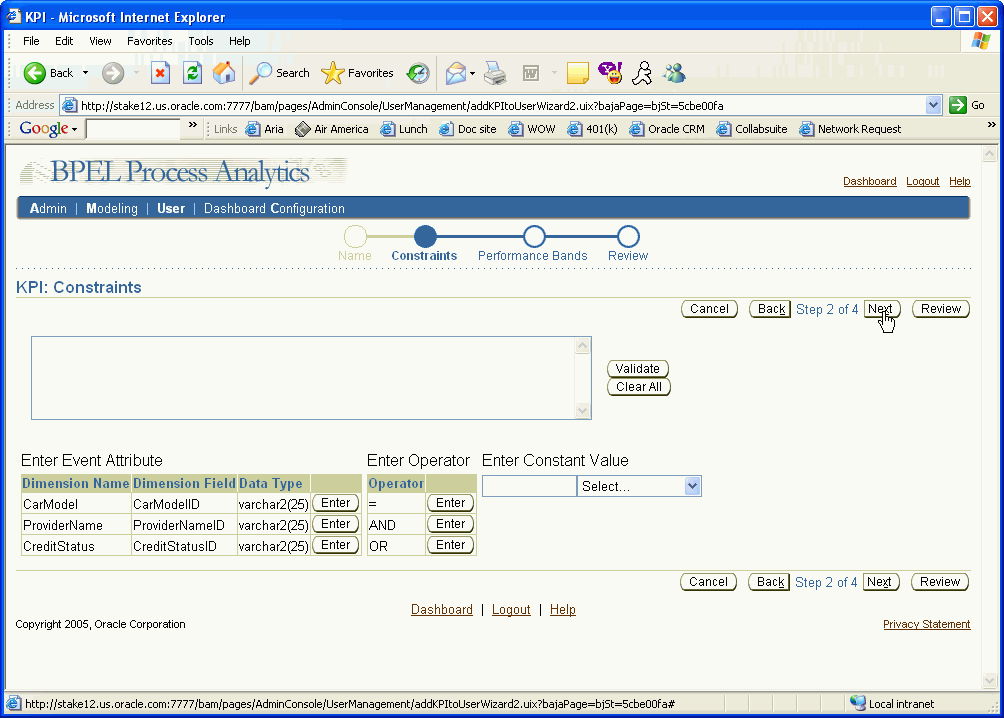
Here you may enter constrains on the KPI. In this case, there are no constraints.
Click Next.

Set performance bands by either selecting a template from the Templates box or by selecting Custom and defining your own.
Click Next.
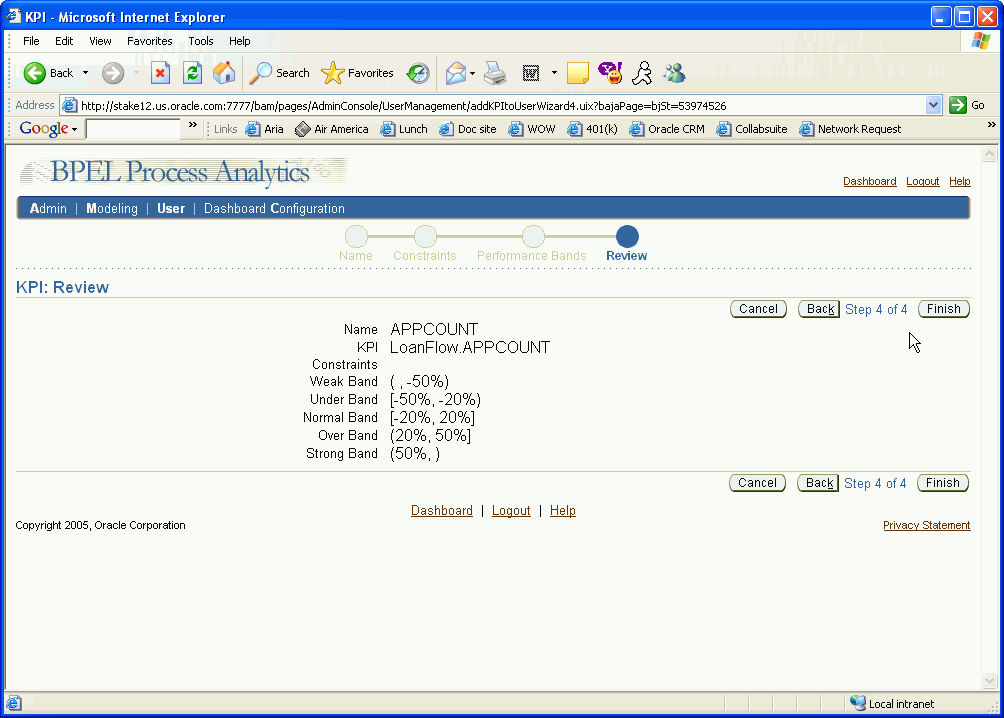
Review the KPI information. To make changes, click the Back button. To accept the KPI, click Finish.
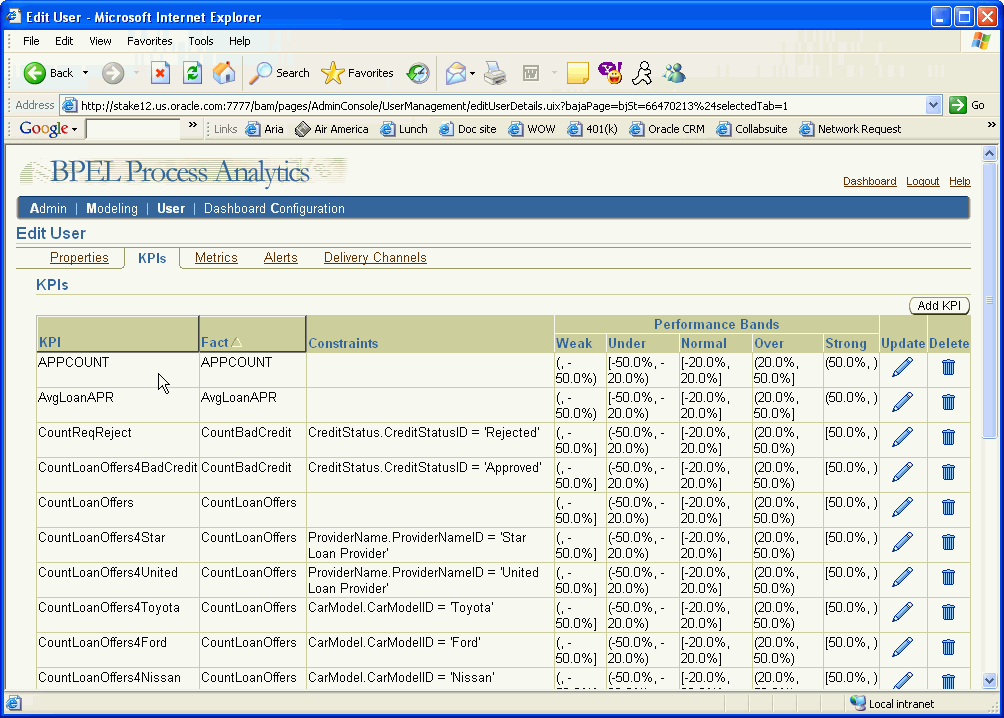
Once you click Finish, the updated KPI list appears.
The star join schema for LoanFlowPlus consists of a fact table, BAM_FACT_LOANFLOW1_T, and four dimension tables, BAM_DIM_PROVIDERNAME_T, BAM_DIM_CARMODEL_T, and BAM_DIM_CREDITSTATUS_T, and BAM_DIM_TIME_ID.
There is another star join schema for the budget table, BAM_BUDGET_LOANFLOW1_T, with the same dimension tables. The entries in the budget table are the same as for the fact table.
The dimensions tables are joined to the fact and budget tables, forming the star join schema. Table 9-3 shows the BAM_FACT_LOANFLOW1_T fact table.
Table 9-3 BAM_FACT_LOANFLOW1_T
| Name | Type | Null? |
|---|---|---|
| TIMEID | NUMBER | NOT NULL |
| CARMODELID | VARCHAR2 (25) | , |
| PROVIDERNAMEID | VARCHAR2 (25) | , |
| CREDITSTATUSID | VARCHAR2 (25) | , |
| REQAPPROVALTIME | NUMBER |
|
| OFFERSELECTTIME | NUMBER |
|
| OFFERAPPROVALTIME | NUMBER |
|
| AVGLOANAPR | NUMBER |
|
| MAXLOANAPR | NUMBER |
|
| MINLOANAPR | NUMBER |
|
| SUMLOANAPR | NUMBER |
|
| COUNTREQ | NUMBER |
|
| COUNTBADCREDIT | NUMBER |
|
| COUNTLOANOFFERS | NUMBER |
|