|
Oracle® Application Server Portal Developer's Guide
10g Release 2 (10.1.4) B14135-02 |
|
 Previous |
 Next |
|
Oracle® Application Server Portal Developer's Guide
10g Release 2 (10.1.4) B14135-02 |
|
 Previous |
 Next |
This chapter shows you how to use OmniPortlet to create four portlets based on different data sources: a Web service, a spreadsheet (CSV), XML, and an existing Web page. You will learn how to create and modify these portlets, as well as use page parameters and events to add interactivity to your portal page.
This chapter includes the following sections:
|
Note: To learn more about specific pages and tabs in OmniPortlet, click the Help link in the top right corner of the wizard. The online Help describes the contents of the selected page or tab. You can also find more information about using OmniPortlet in Chapter 3, "Creating Portlets with OmniPortlet", or about registering and configuring OmniPortlet with Oracle Application Server Portal in Appendix I, "Configuring the Portal Tools Providers" in the Oracle Application Server Portal Configuration Guide. |
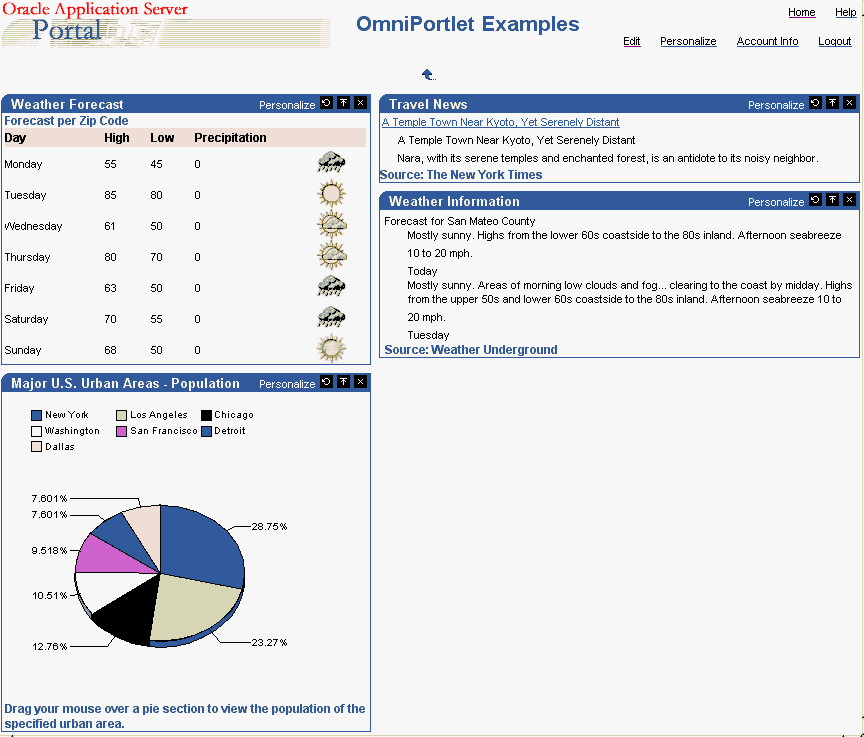
At the end of this chapter, you will create a page that contains four portlets, as shown in Figure 4-1.
Figure 4-1 Portal Page with Four OmniPortlet Examples

All four of these example portlets require you to be able to connect to the Internet. If you must use a proxy server to connect to the Internet, you will need to configure the HTTP proxy settings on the OmniPortlet Provider Test page to use proxy authentication. If the OmniPortlet provider has been set up to use proxy authentication that requires your login, you can enter your user information in the Proxy Authentication section of the Source tab in the OmniPortlet wizard. For more information on proxy authentication, refer to Section 3.2.2, "Source". For specific information on configuring the provider's proxy settings, refer to the Oracle Application Server Portal Configuration Guide, available on the OracleAS Portal Documentation page on OTN.
OmniPortlet is available with OracleAS Portal. However, if you installed the Oracle Application Server Portal Developer Kit separately, instructions on registering and configuring OmniPortlet with Oracle Application Server Portal are located in Appendix I, "Configuring the Portal Tools Providers" in the Oracle Application Server Portal Configuration Guide.
|
Note: The steps in this chapter assume that you are using the OmniPortlet provider that is available with OracleAS Portal. If you installed the Oracle Application Server Portal Developer Kit separately, you may need to slightly modify the instructions when adding an OmniPortlet instance to the page. |
In this section, you will learn how to add an OmniPortlet instance to your portal page.
To add an OmniPortlet instance to a page:
In the Edit mode of the page where you want to add the OmniPortlet, click the Add Portlets icon.
On the Add Portlets page, in the Available Portlets list, click the Portlet Builders link.
Click the OmniPortlet link. You will see OmniPortlet listed in the Selected Portlets list.
Click OK. The new instance of OmniPortlet now displays on your portal page, as shown in Figure 4-2.
Figure 4-2 OmniPortlet Instance on a Portal Page

The steps in this section will show you how to create a portlet that displays weather forecast information for a particular zip code. You will base this portlet on the Web Service available on the Oracle Technology Network. You will need Internet access to be able to complete this section.
To create an OmniPortlet based on a Web Service:
In the new OmniPortlet instance on your portal page, click the Define link to launch the OmniPortlet Wizard.
On the Type page, select the Web Service radio button, then click Next.
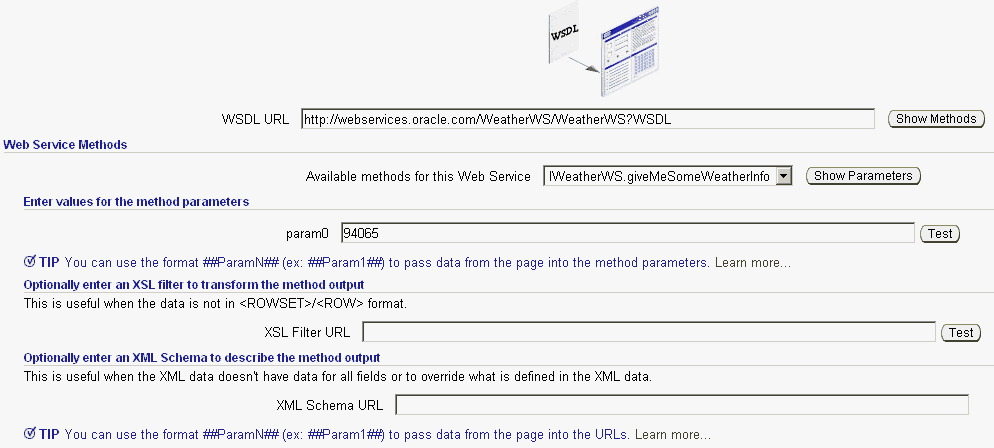
On the Source page, in the WSDL URL field, enter the following URL:
http://webservices.oracle.com/WeatherWS/WeatherWS?WSDL
|
Note: This Web Service has one method (WeatherWS.giveMeSomeWeatherInfo) and accepts one parameter (param0). If you use a method that has parameters, the parameters will display in this section of the tab. You can enter a sample value for the parameter, then click Test to view the sample XML data, the SOAP response, and the SOAP Request.
|
Click Show Methods.
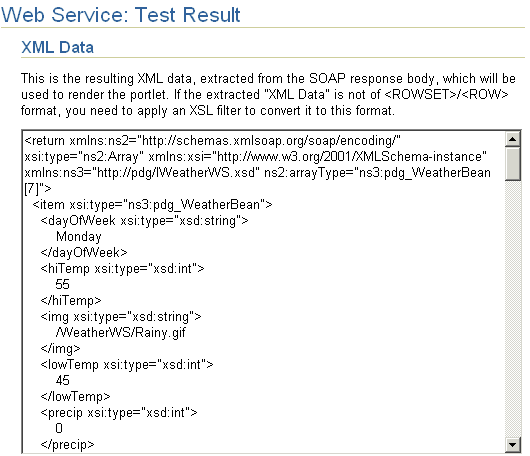
In the Web Service Methods section, in the param0 parameter field, enter a sample Zip code (for example, 94065), then click Test. The Web Service: Test Result window displays, where you can verify the XML data returned by the Web Service, as shown in Figure 4-3.
Figure 4-3 OmniPortlet: Web Service Test Results Page
Close the window.
The Source page should look like the image shown in Figure 4-4.
Figure 4-4 OmniPortlet: Web Service Source Tab
|
Note: If you do not have access to the Internet, you can use the another Web Service, but keep in mind that your results will not match the example in this chapter. |
Click Next.
On the Filter page, click Next.
On the View page, in the Title field, enter Weather Forecast.
In the Header Text field, enter Forecast per Zip Code.
Make sure the Show Header Text check box is selected, and clear the Show Footer Text check box, as shown in Figure 4-5.
Figure 4-5 OmniPortlet: Web Service View Tab

Make sure the Tabular radio button is selected, then click Next.
On the Layout page, select the Plain radio button.
Specify the Column Label, Column, and Display As properties for your data according to the following table:
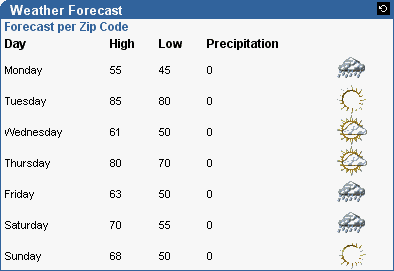
Now that you've completed defining the portlet, click Finish. Your portlet should look like Figure 4-6.
Figure 4-6 OmniPortlet: Web Service Portlet
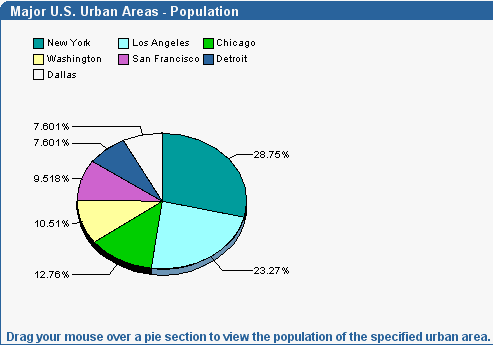
The steps in this section show you how to use OmniPortlet to define a portlet that displays regional information based on a spreadsheet (CSV) data source. This portlet will display the population of major U.S. urban areas in a pie chart.
To create an OmniPortlet based on a spreadsheet:
Create a region below the existing region on your portal page.
Add an OmniPortlet to this new region.
Launch the OmniPortlet Wizard by clicking the Define link.
On the Type page, select the Spreadsheet radio button, then click Next.
On the Source page, in the CSV URL field, replace the existing text with the following CSV:
http://webservices.oracle.com/WeatherWS/city_population.csv
|
Note: If you do not have access to the Internet, you can use the default URL, but keep in mind that your results will not match the example in this chapter. |
Click Next.
On the Filter page, click Next.
On the View page, in the Title field, enter Major U.S. Urban Areas - Population.
Clear the Show Header Text check box.
In the Footer Text field, enter Click a pie section to view the population of the specified urban area.
|
Note: The text you just entered in the Footer Text field instructs your end users to click a pie section to view more details about the selected population. To enable this feature, you will need to complete the steps in Section 4.6, "Setting Up Portlet Parameters and Events". |
Ensure that the Show Footer Text check box is selected.
Under Layout Style, select the Chart radio button, then click Next.
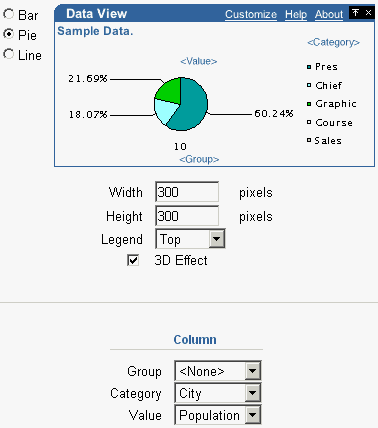
On the Layout page, select the Pie radio button.
In the Width field, enter 300.
In the Height field, enter 300.
From the Legend list, choose Top.
Select the 3D Effect check box.
Under Column Layout, from the Group list, choose <None>.
From the Category list, choose City.
From the Value list, choose Population. The Layout tab should now look like the image shown in Figure 4-7.
Figure 4-7 OmniPortlet: Character-Separated Values (CSV) Layout Tab
Click Finish.
Your portlet now displays on your portal page below the Weather Forecast portlet, and should look like Figure 4-8.
Figure 4-8 OmniPortlet: CSV OmniPortlet on the Page
The steps in this section will show you how to use OmniPortlet to define a portlet that displays news information in a scrolling layout, based on an XML data source.
To create an OmniPortlet based on an XML data source:
Create a region next to the Web Services portlet (Weather Forecast) on your portal page.
Add an OmniPortlet to this new region.
Launch the OmniPortlet Wizard by clicking the Define link.
On the Type page, select the XML radio button, then click Next.
On the Source page, in the XML URL field, enter the following URL:
http://www.nytimes.com/services/xml/rss/nyt/Travel.xml
|
Note: I you do not have access to the Internet, you can use a different RSS feed, but keep in mind that your results will not match the images in this example. |
In the XSL Filter URL field, enter the following URL for the XSL file:
http://www.oracle.com/technology/products/ias/portal/viewlets/omniportletnews.xsl
|
Note: This XSL filter transforms the RSS news feed into the ROWSET/ROW structure that OmniPortlet can consume. |
Click Next.
On the Filter page, click Next.
On the View page, in the Title field, enter Travel News.
Clear the Show Header Text check box.
In the Footer Text field, enter Source: The New York Times.
Ensure that the Show Footer Text check box is selected.
Under Layout Style, select the News radio button, then click Next.
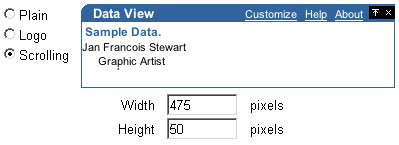
On the Layout page, under News Style, select the Scrolling radio button.
In the Width field, enter 475.
In the Height field, enter 50.
The News Style section of the Layout tab should now look like the image shown in Figure 4-9.
Figure 4-9 OmniPortlet: XML Layout Tab - News Style
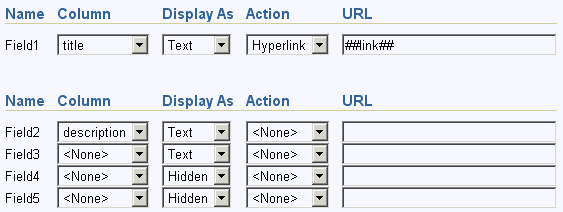
Under Column Layout, next to Field 1 choose title from the Column list, Hyperlink from the Action list, and enter ##link## in the URL field, as shown in Figure 4-10.
Figure 4-10 OmniPortlet: News Style Column Layout

Next to Field2, choose description from the Column list and leave the default values for the other settings. Ensure this section of the Layout tab looks like Figure 4-11.
Figure 4-11 Column Layout Section of the Layout Tab
Click Finish.
Your portlet now displays on your portal page, as shown in Figure 4-12.
Figure 4-12 OmniPortlet: XML Scrolling News OmniPortlet on the Page

The steps in this section will show you how to use OmniPortlet to create a portlet that displays weather information in a text format based on an existing Web Page. In this section, you will use OmniPortlet to clip and scrape content from Web sites.
To create an OmniPortlet based on a Web page data source:
Create a region on your portal page.
Add an OmniPortlet to this new region.
Launch the OmniPortlet Wizard by clicking the Define link.
On the Type tab of the OmniPortlet Wizard, select the Web Page radio button, then click Next.
On the Source tab, click Select Web Page.
On the Web Clipping Studio page that displays, in the URL Location field, enter the URL of the page you want to clip:
http://www.wunderground.com
|
Note: You can use a different Web page, but keep in mind that your results will not match the example in this chapter. |
|
Note: In this example, we use a third party Web site owned by The Weather Underground, Inc. Because this Web site is continually updated based on current weather forecasts, the images and steps included in this section may not reflect exactly what you see when you create this example. As you go further into this example, some of the steps may not work, as the owners may change the technology of this third party Web site. |
Click Start to display the Web Clipping Studio. You should see the Web page display in the Web Clipping Studio, as shown in Figure 4-14.
Figure 4-14 Web Clipping Studio Containing the www.wunderground.com Home Page
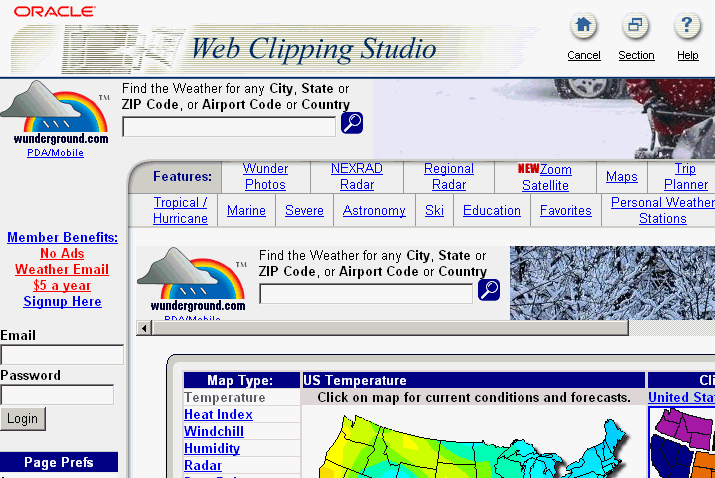
On the home page, enter a zip code (for example, 94065) in the Weather field, as shown in Figure 4-15, then click the magnifying glass icon next to the field.
Figure 4-15 Entering the Zip Code 94065 into the Weather Field

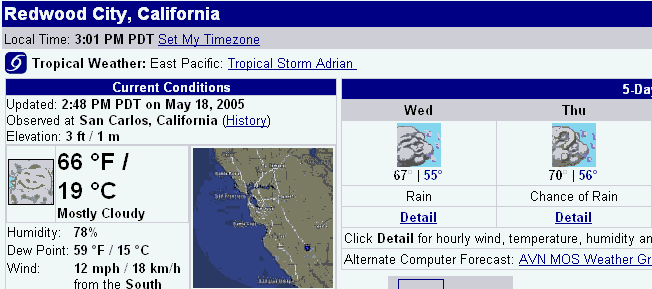
The weather information for Redwood City, California displays in the Web Clipping Studio. A segment of the page is shown in Figure 4-16.
Figure 4-16 Weather Information for Redwood City, California
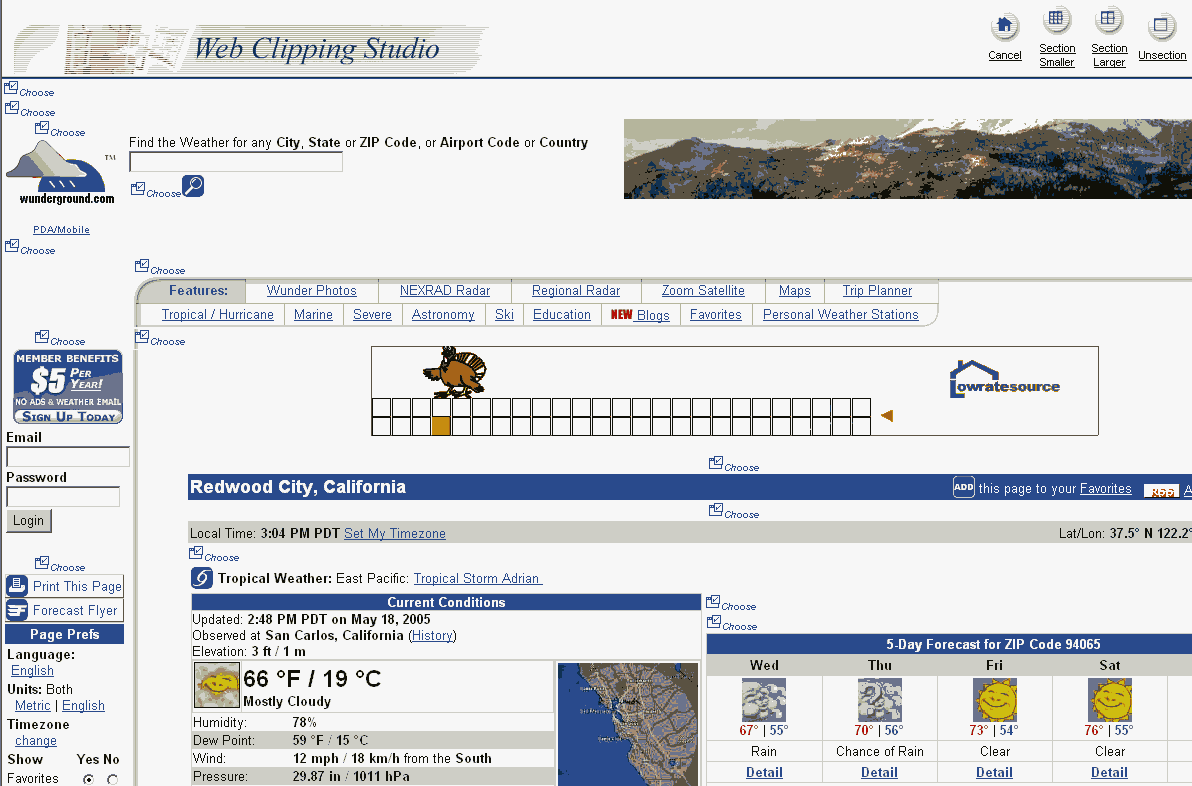
In the top right corner of the Web Clipping Studio, click the Section button, as shown in Figure 4-17.
After you click the Section button, you'll notice that the elements of the Web page are broken down, and that a new icon displays called Choose at the top of each section. Figure 4-18 shows a snapshot of the Web Clipping Studio.
Figure 4-18 Web Clipping Studio Displaying the Web Page Sections
Find the section shown in Figure 4-19, which shows the weather information for the city you chose (in this example, San Mateo County).
Figure 4-19 Weather Information for San Mateo County with the Choose Icon
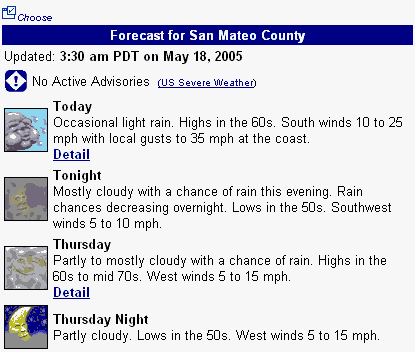
Click the Choose icon for this section, located directly above the "Forecast for San Mateo County" title bar, as shown in Figure 4-19. The section displays in the Web Clipping Studio, as shown in Figure 4-20.
Figure 4-20 Weather Information Section for San Mateo County in the Web Clipping Studio
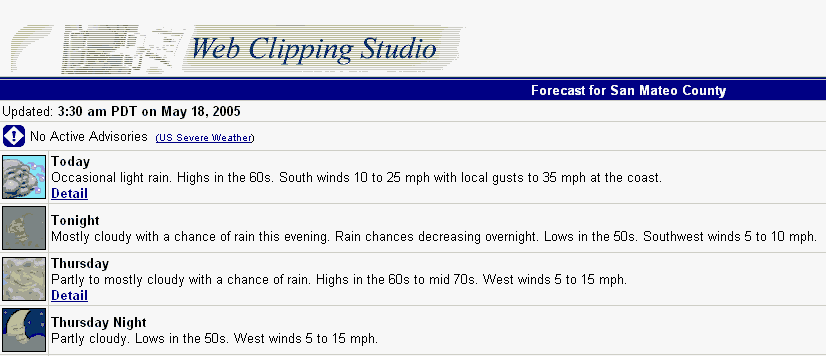
After you have chosen the clipping, you can refine your data further by scraping the data, that is, selecting specific cells you wish to display in your portlet. Click the Scrape button.
While in Scraping mode, you can identify the text pieces in the Web clipping by selecting the check boxes next to each item. You can repeat these items at the column level, row level, or table level.
In this example, we want to show the title and the description of each resulting article from our search. We can repeat the title and description at the row level, so that each result returned by the search displays only the title and the description of every result. In general, you choose the text items in the first row that contains all the pieces you wish to repeat for each row.
After you click the Scrape button, you'll notice that check boxes display next to each item on the Web page, as shown in Figure 4-22.
Select the output you want by selecting the check boxes next to the items.Figure 4-23 shows an example of a check box.
Figure 4-23 Check Box for San Mateo County Title

|
Note: Depending on the color of the section you want to select, the check boxes may not be prominently displayed. |
After you select the check box for ÒForecast for San Mateo County,Ó notice that a corresponding label displays in the Data section of the Web Clipping Studio at the bottom of the screen, as shown in Figure 4-24.
Figure 4-24 San Mateo County Label in Data Section

In the Name field, enter a more meaningful name, such as "SanMateoCountyForecast." Do not include spaces in the name.
Select the fields you wish to display and add the corresponding labels as you select them. The following is a list of sample information we chose for this example, but you can choose your own examples depending on the current weather. You can see the selected weather information in Figure 4-25.
Forecast for San Mateo County title
Today
Today's Weather
Thursday
Thursday's Weather
|
Note: With the Web page data source, you can select URLs as part of your Web clipping. In Oracle Application Server Portal 10.1.2 and later, the context of the application is maintained. So, for example, any images that display on the hyperlinked page will be maintained. |
Now that you've selected the data you want to display, click the Continue button, as shown in Figure 4-26.
On the page that displays, verify that the information in the Clipping Attributes section includes the title: "Weather Underground: Redwood City, California Forecast," as shown in Figure 4-27.
Figure 4-27 Clipping Attributes Section of the Web Clipping Studio

Verify that the information in the Clipping Parameters section includes the parameters as shown in Figure 4-27.
Figure 4-28 Clipping Parameters Section of the Web Clipping Studio

Select the Clipping Parameter? check box for the second parameter with the name "query."
Click OK.
On the Source tab of the OmniPortlet Wizard, the new title and description now display. To edit the Web clipping in the Web Clipping Studio, you can click the Select Web Page button again, as shown in Figure 4-29.
Under the Clipping Parameters heading, you should see the clipping parameter you set on the previous page, as shown in Figure 4-30:
Figure 4-30 Clipping Parameter to Portlet Parameter Mapping

Under the Portlet Parameters heading, next to Param1, set the Default Value to the zip code, 94065, as shown in Figure 4-31.
Click Next.
On the Filter tab, click Next.
On the View tab, in the Title field, enter Weather Information.
In the Footer Text field, enter Source: Weather Underground and make sure the Show Footer Text check box is selected.
Under Layout Style, select the News radio button. The View tab should look like Figure 4-32.
Figure 4-32 View Tab with the Options Selected
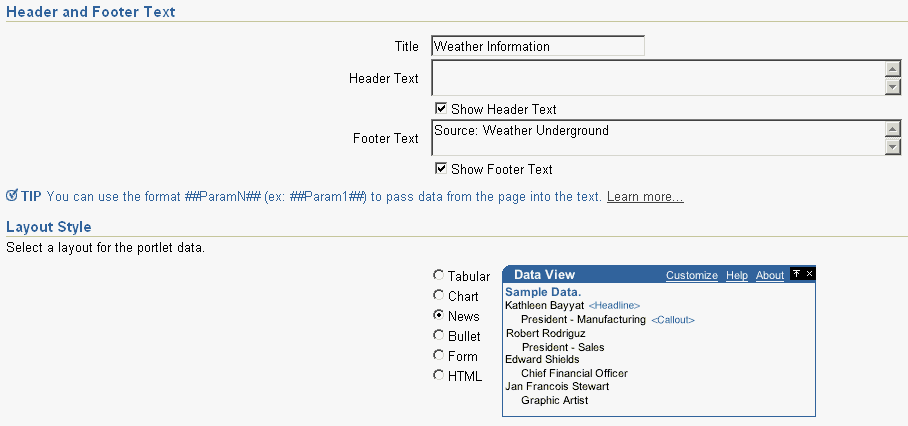
Click Next.
Verify that the Layout tab looks like Figure 4-33.
Click Finish.
Your new Web Page portlet displays on the portal page, and should look like Figure 4-34.
Figure 4-34 Weather Information Portlet on the Portal Page

Now that you have completed building all four example OmniPortlets, your page should look like Figure 4-35.
Figure 4-35 Portal Page Displaying the Four Example OmniPortlets

The steps in this section show you how to set up the portlets and page you created to use parameters. Then, when a user clicks a slice of the pie chart (generating a portlet event) that corresponds to a region (for example, New York), the Weather Forecast per Zip Code portlet (based on a Web Service) and the Weather Information portlet (based on a Web page) will display the corresponding weather information for that region (New York).
To set up portlet parameters and events, you will need to:
The steps in this section will show you how to configure the two portlets on your page that accept parameters (the Web Service portlet that displays Weather Forecast per Zip Code information and the Web page portlet that displays Weather Information).
To configure the two portlets to accept parameters:
In Edit mode of the page, click the Edit Defaults icon in the top left corner of the Web Services portlet, as shown in Figure 4-36.
Figure 4-36 Edit Defaults Icon in the Web Services Portlet
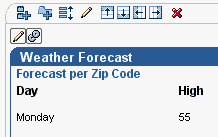
On the Source tab, replace the value of param0 (94065) with ##Param1##, as shown in Figure 4-37.
Under Portlet Parameters, set the default value of Param1 to 94065.
In the Personalize Page Label field, enter Zip.
In the Personalize Page Description field, enter Enter zip code, as shown in Figure 4-38.
Figure 4-38 Portlet Parameters Section of the Web Services Source Tab

Click OK.
On the portal page, in Edit mode, click the Edit Defaults icon for the Web page portlet, as shown in Figure 4-39.
Figure 4-39 Edit Defaults Icon for the Web Page Portlet
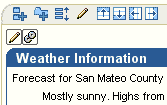
On the Source tab, since you have already mapped a portlet parameter to the clipping parameter, you can simply add a label and description to the portlet parameter Param1, as shown in Figure 4-40.
Figure 4-40 Portlet Parameters Section of the Web Page Source Tab

Click OK.
You have created two portlet parameters in the Web Services and Web page portlets to accept page parameters. Next, you will map a page parameter to these two portlet parameters.
The steps in this section will show you how to map the page parameters to the two portlets you configured in the previous section.
To map the page parameter to the portlet parameters:
On the page, in Edit mode, click the Page: Properties link at the top of the screen.
Click the Parameters tab.
Under New Page Parameter, in the Parameter Name field, enter zip, then click Add, as shown in Figure 4-42.
Under Page Parameter Properties, the new page parameter displays. In the Default Value field, enter 94065, as shown in Figure 4-43.
Figure 4-43 Default Value for the "zip" Page Parameter

Under Portlet Parameter Values, you will see a list of portlets listed. If you have followed all the steps in this chapter, you will see four instances of OmniPortlet listed. The Web Services portlet is the first in the list, and the Web Page data source is the fourth (or the bottom) instance of OmniPortlet in the list.
Click the arrow next to the first instance of OmniPortlet to expand the Portlet Parameters list, as shown in Figure 4-44.
Figure 4-44 Portlet Parameter Values Section
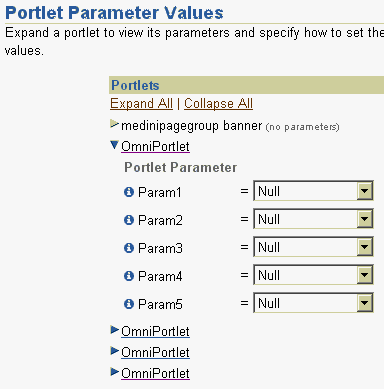
Next to Param1, from the list, choose Page Parameter.
From the list that displays, ensure that zip is selected.
For the fourth OmniPortlet in the list, follow the same steps to set Param1 to the Page Parameter of zip, as shown in Figure 4-45.
Figure 4-45 Portlet Parameters Section of the Page Parameters Tab
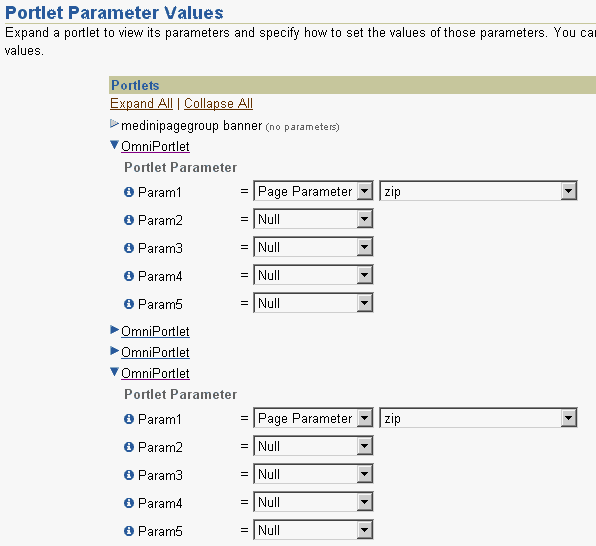
The page parameter zip is now mapped to the portlet parameters for the Web Services and Web page portlets. Next, you will set up the chart portlet so that when a slice of the pie chart is clicked, the selected zip code will be sent to the page.
The steps in this section will show you how to configure the chart portlet to use events. That is, based on an event in the portlet (such as clicking a slice in a pie chart), an event will occur. In this case, you will configure the portlet so that when a slice is clicked by an end user, the zip code associated with that slice will be sent to the page. Then, the data in the two portlets you configured in Section 4.6.1, "Configure Portlets to Accept Parameters" will refresh depending on the selected zip code.
To configure the chart portlet:
In the Edit mode of the page, click the Edit Defaults icon for the chart portlet, as shown in Figure 4-46.
Figure 4-46 Edit Defaults Icon for the Chart Portlet
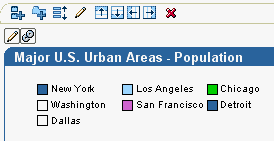
Click the Layout tab.
Under Chart Drilldown, choose Event1 from the Action list.
Notice that in Edit Defaults mode, a new tab displays in the wizard called Events. Click the Events tab.
On this tab, you will configure Event1 (which you set on the Layout tab) to pass the zip code from the chart to the page as the event output.
Set Event1Param1 to zipcode, as shown in Figure 4-47, then click OK.
Figure 4-47 Events Tab for the Chart Portlet

You have configured the chart portlet so that a user can click a slice of the pie chart, and set up an event so that the zip code selected in the pie chart will be sent to the page. Next, you will set up the page to accept this event parameter.
The steps in this section will show you how to map the chart event you created in the previous section to the page, so that when a user clicks on a slice of the pie chart, the zip code selected in the pie chart will be accepted by the page as the page input. The page will then display the data that corresponds to the selected zip code in the Web Service and Web page portlets.
To map the chart event to the page:
On the page, in Edit mode, click the Page: Properties link, then click the Events tab.
Expand the second OmniPortlet in the list to display the events, and select Event1, as shown in Figure 4-48.
Figure 4-48 Portlet Events Section of the Page Events Tab
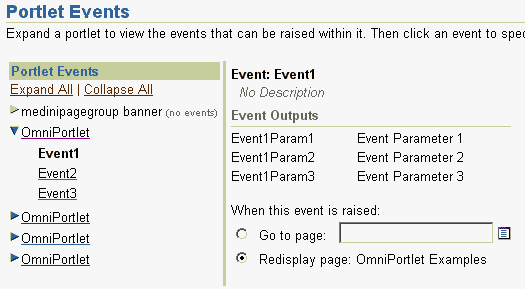
Select the Go to page radio button, then, next to the field, click the Browse Pages icon to search for the name of your page (in this case, OmniPortlet Examples). Next to your page name, click Return Object.
|
Note: If you do not know the name of the page, you can return to the Edit mode of the page by clicking Cancel. Then, click the Page Group: Properties link to view the display name of the page group. When you return to the Events tab of the Page Properties, you can click the Browse Pages icon to search for the page group, under which you should see the page name. |
Set the Page Input as shown in Figure 4-49.
Click OK.
Now, when you drag your mouse over the pie chart in the Chart portlet, you should notice that you can click one of the sections. Try clicking on the largest slice (New York). You will notice that the page refreshes.
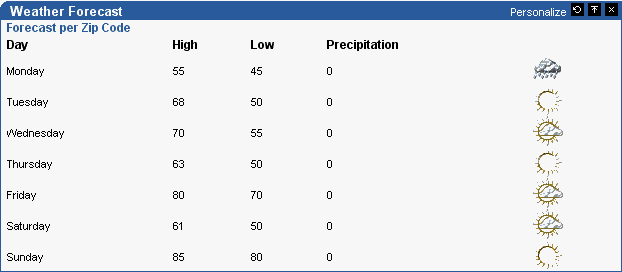
In the URL of the page, you should see a parameter value set after the page name, for example: OmniPortlet%20Examples?zip=10001. The Weather Forecast information changes, and looks something like Figure 4-50.
Figure 4-50 Weather Forecast (Web Service) Portlet for New York
The Weather Information portlet changes, and looks something like Figure 4-51.
Figure 4-51 Weather Information (Web Page) Portlet for New York


In this chapter, you learned how to use OmniPortlet to build various types of portlets on a page. You also learned how to use parameters and events to integrate portlets on a page and create a portal application. You can find more information about using the various tools in OmniPortlet by clicking the Help link on each of the pages in the wizard. To learn more about parameters and events, refer to the Oracle Application Server Portal User's Guide available on OracleAS Portal Documentation page on OTN (http://www.oracle.com/technology/products/ias/portal/documentation.html)