|
Oracle® Reports Building Reports
10g Release 2 (10.1.2) B13895-01 |
|
 Previous |
 Next |
|
Oracle® Reports Building Reports
10g Release 2 (10.1.2) B13895-01 |
|
 Previous |
 Next |
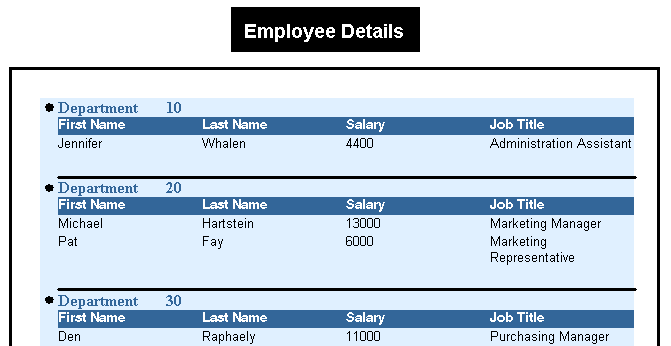
In this chapter, you will learn about reports that include graphics, text, and color. By following the steps in this chapter, you can generate the report output shown in Figure 18-1.
Figure 18-1 Graphics, text, and color report output
Concepts
Reports Builder enables you to modify the look of your report in multiple ways. In this example, you will build a report and enhance it by adding an image to the margin, a title, and a border. You will also change the look of the report by applying different fonts and text styles.
This report shows you how to enhance your reports with graphics by:
For more information on enhancing the appearance of your reports, refer to the Oracle Reports online Help.
Data Relationships
This is a one-query group left report.
Layout
This report uses a Group Above layout, which you will modify in the Paper Layout view to make room for the title and company logo. Then, you will import the logo, create the report title, and the rest of the graphics shown in the image above.
Example Scenario
As you build this example report, you will:
Create a simple report definitionusing the Report Wizard to create one query that selects all the columns for this report, and assign a column to a new break group.
Modify the report in the Paper Layout view to:
Change the font size and style using the Font dialog box.
Add bullets to your report using the tool palette.
Display a line between each record using the Line tool.
Add a title to your report using the Fill Color tool and other layout tools.
To see a sample report with graphics and highlighted text, open the examples folder named graphics, then open the Oracle Reports example named graphics.rdf. For details on how to open it, see "Accessing the Example Reports" in the Preface.
To build the example in this chapter, you must have access to the Human Resources sample schema (HR) provided with the Oracle Database. If you do not know if you have access to this sample schema, contact your database administrator.
When you create a report, you can either use the Report Wizard to assist you or create the report yourself. In this example, you will use the Report Wizard to create your query and basic report layout.
To create the report definition:
Launch Reports Builder (or, if already open, choose File > New > Report).
In the Welcome or New Report dialog box, select Use the Report Wizard, then click OK.
If the Welcome page displays, click Next.
On the Report Type page, select Create Paper Layout Only, then click Next.
On the Style page, type a Title for your report, select Group Above, then click Next.
On the Data Source page, click SQL Query, then click Next.
On the Data page, enter the following SELECT statement in the Data Source definition field:
SELECT ALL DEPARTMENTS.DEPARTMENT_ID, EMPLOYEES.FIRST_NAME, EMPLOYEES.LAST_
NAME, EMPLOYEES.JOB_ID, EMPLOYEES.SALARY, JOBS.JOB_TITLE
FROM DEPARTMENTS, EMPLOYEES, JOBS
WHERE ((DEPARTMENTS.DEPARTMENT_ID = EMPLOYEES.DEPARTMENT_ID)
AND (EMPLOYEES.JOB_ID = JOBS.JOB_ID))
ORDER BY DEPARTMENTS.DEPARTMENT_ID
|
Note: You can enter this query in any of the following ways:
|
Click Next.
|
Note: If you are not already connected to a database, you will be prompted to connect to the database when you click Query Builder or Next. Ensure that you connect to a database that has the appropriate schema for this example. Section 18.1, "Prerequisites for this example" describes the sample schema requirements for this example. |
On the Groups page, click DEPARTMENT_ID and click the right arrow (>) to move this field to the Group Fields list, then click Next.
On the Fields page, move all fields except JOB_ID to the Displayed Fields list, then click Next.
On the Totals page, click Next.
On the Labels page, change the label Department Id to Department, then click Next.
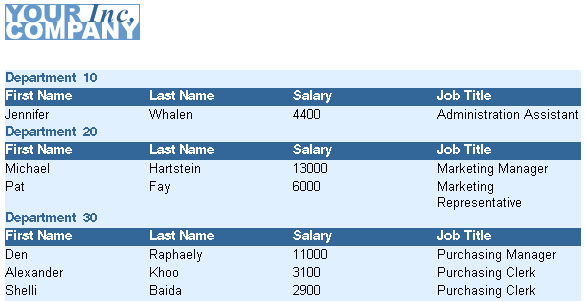
On the Template page, select Predefined Template and click Blue, then click Finish to display your report output in the Paper Design view. It should look something like this:
Figure 18-2 Paper Design view for the graphics report with one query
The steps in this section show you how to use the various tools in the Paper Layout view to modify the appearance of your report. First, you will move the existing frames to accommodate the changes you will make. You will then add a title to your report, borders around each record, and change the text color.
To modify your report:
Click the Paper Layout view button in the toolbar to display the Paper Layout view.
Make sure the Confine On button in the toolbar is set to Confine mode on. Doing so enables you to move the objects in the Paper Layout view around the canvas.
In the Object Navigator, under Paper Layout > Main Section > Body, click the item M_G_DEPARTMENT_ID_GRPFR.
Notice that, in the Paper Layout view, the outermost frame is selected.
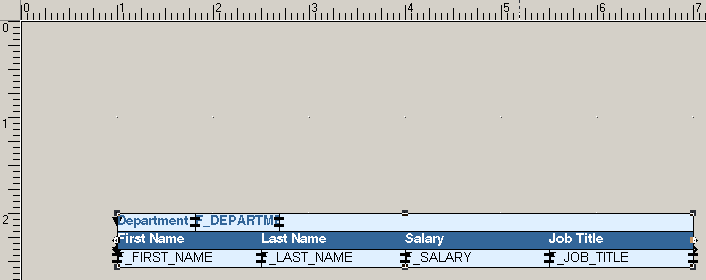
Using the arrow keys, move the frame about 2 inches (5 centimeters) down and 1 inch (2.5 centimeters) to the right.
You can use the rulers along the sides of the Paper Layout view as guidance. Your Paper Layout should now look something like this:
Figure 18-3 Paper Layout View of Adjusted Report Layout
Now, make sure Flex mode is on and click the Confine Off button in the toolbar to set Confine mode off.
Make space for the border you will create that will surround each record. In the Object Navigator, select M_G_DEPARTMENT_ID_GRPFR again.
Drag each corner to make space around the inner repeating frame, so that the layout now looks like the following image. Notice the white space around the groups.
Figure 18-4 Paper Layout View with Expanded Repeating Frame

Now, let us make space between each record so that we can later put a horizontal line between the records. In the Object Navigator, click R_G_DEPARTMENT_ID.
In the Paper Layout view, click the bottom right corner and drag it down about 0.5 inches (1.5 centimeters) so that your layout now looks like this:
Figure 18-5 Paper Layout View with Expanded R_G_DEPARTMENT_ID Repeating Frame

Save your report as graphics_your_initials.rdf.
Now that you have set up your layout, you can start adding new items. In this section, you will add a border around the entire report.
To add a border:
In the Object Navigator, select the M_G_DEPARTMENT_ID_GRPFR frame.
In the Paper Layout view, while the M_G_DEPARTMENT_ID_GRPFR frame is selected, click the Line Color tool. The tool can be found at the very bottom of the tool palette.
In the color palette that displays, choose the black square to make the border black.
While the line is still selected, choose Format > Line > Line Width > 2 pt.
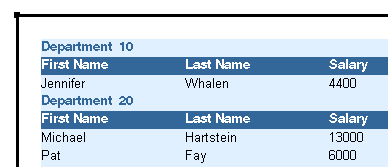
Now, preview the layout. In the toolbar, click the Paper Design button to run the report to paper. It should look something like this:
Figure 18-6 Preview of the Report with a Border
Save your report as graphics_your_initials.rdf.
In the Paper Layout view, you can also change the font and style of the text. The steps in this section will show you how to modify the Department Number text.
To change the font:
In the Paper Design view, click the Paper Layout button in the toolbar.
In the Object Navigator, select the B_DEPARTMENT_ID and F_DEPARTMENT_ID fields so that you can change the font of the Department ID label and text.
|
Note: B_DEPARTMENT_ID refers to the boilerplate text "Department ID", which serves as the label for the F_DEPARTMENT_ID field. |
Click the title bar of Paper Layout view to make it the active window.
While the two fields are selected, choose Format > Font.
In the Font dialog box, choose a different font and size. In the example, we chose Times New Roman and 12 pt.
When you have finished your changes, click OK.
|
Note: Depending on the font and font size you choose, you may have to adjust the size of the fields to accommodate the text. In the example, since the font was increased, we selected the boilerplate text field and enlarged it. |
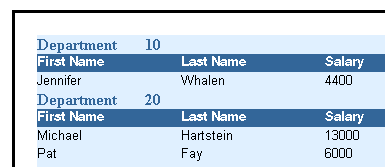
Display your report in the Paper Design view to see what it looks like. Here's an example:
Figure 18-7 Paper Design View of the Report with New Fonts
Save your report as graphics_your_initials.rdf.
The steps in this section will show you how to add bullets so that a bullet displays next to each department ID.
To add bullets to your report:
In the Paper Layout view, make sure you have enough space next to the B_DEPARTMENT_ID field where you can add a bullet. The bullet needs to be within the R_G_DEPARTMENT_ID repeating frame so that it displays for each record.
Click the Ellipse tool in the tool palette.
Press the SHIFT key, then draw an ellipse next to the boilerplate text "Department."
|
Note: Pressing the SHIFT key while you draw the ellipse puts the tool in a "constrained" mode. When you create an ellipse in this mode, you can create a circle. Other tools are similar; for example, constraining the Rectangle tool creates a square. For more information on using these tools, refer to the Oracle Reports online Help. |
You should now see a circle in the repeating frame. To make the bullet a solid color, select the circle, then click the Fill Color tool in the tool palette.
In the color palette that displays, choose black.
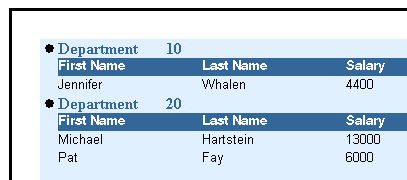
Run your report to the Paper Design view to see what it looks like.
|
Note: When you are checking your layout, make sure that the ellipse displays within the R_G_DEPARTMENT_ID repeating frame. |
Figure 18-8 Paper Design View of the Report with Bullets
Save your report as graphics_your_initials.rdf.
When you have a lot of data, you sometimes want to further distinguish each record, so that it is clear how the information is related. In this section, you will add a horizontal line to the layout that will display between each department record.
To add a line separator:
In the Paper Layout view, click the Line tool in the tool palette.
Press the SHIFT key, then draw a line in the R_G_DEPARTMENT_ID frame beneath the fields, like this:
Figure 18-9 Paper Layout View with Line Separator

Format the line the way you want it to appear. In our example, we chose Format > Line > Line Width > 2 pt. Then, we changed the color to black.
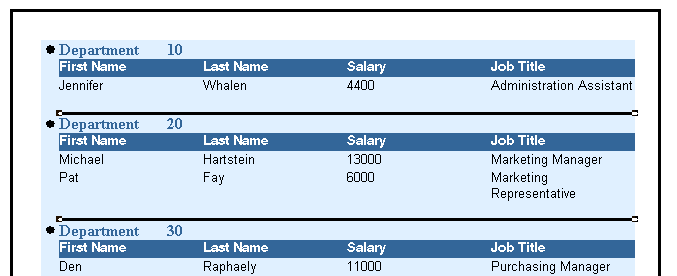
Run your report to the Paper Design view. It should now look something like this:
Figure 18-10 Paper Design View of Report with Line Separator
Save your report as graphics_your_initials.rdf.
The steps in this section will show you how to use the tools in the tool palette to create a title for your report. You will use the Fill Color to create a black background and white text, as well as arrange your items so they display properly.
To add a title to the report:
In the Paper Layout view, click the Rectangle tool in the tool palette.
Draw a rectangle where you want the title to display. We drew the rectangle above the repeating frames, so that the title would display once, above all the data.
Click the Text tool in the tool palette, then click in the rectangle and type a title, such as "Employee Details."
With the text object selected, click the Text Color tool and choose white.
With the rectangle object selected, click the Fill Color tool in the tool palette, and choose black.
In the Object Navigator, find the text object you created under Body. You can tell which objects are text objects by the A icon next to the name. In our case, the text object is B_3.
Once you have selected the object, click the title bar of the Paper Design view to select the Paper Design view.
Choose Layout > Bring to Front.
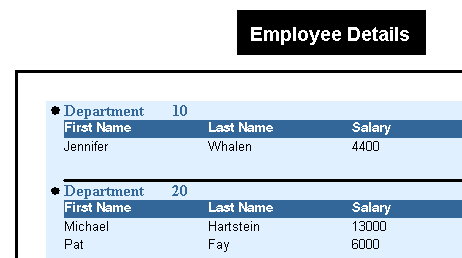
Run your report to the Paper Design view. It should now look something like this:
Figure 18-11 Paper Design View of Report with Title
Save your report as graphics_your_initials.rdf.
Congratulations! You have successfully created a paper report and modified the text color and fill colors, as well as added graphics. You now know how to:
use the Report Wizard to create a simple report definition.
modify the layout of the objects in your report.
add a border to the report.
add bullets to each record.
add a horizontal separator between each record.
add a title to your report using fill colors and layout features.
For more information on any of the wizards, views, or properties used in this example, refer to the Oracle Reports online Help, which is available in Reports Builder or hosted on the Oracle Technology Network (OTN), as described in Section 3.1.1, "Using the Oracle Reports online Help".