|
Oracle® Reports Building Reports
10g Release 2 (10.1.2) B13895-01 |
|
 Previous |
 Next |
|
Oracle® Reports Building Reports
10g Release 2 (10.1.2) B13895-01 |
|
 Previous |
 Next |
In this chapter, you will learn about matrix reports. By following the steps in this chapter, you can generate the report output shown in Figure 25-1.
Concepts
A matrix report looks like a grid. As shown by the example report above, it contains one row of labels, one column of labels, and information in a grid format that is related to both the row and column labels.
This sample matrix also contains three additions to the basic matrix: summaries have been added, zeroes replace non-existent values in the cells, and the cells themselves are surrounded by grid lines. Of the summaries, one sums the salaries by department, one sums them by job, and one sums them for the whole report.
Certain requirements exist for building matrix reports:
You must have at least four groups in your data model.
At least two of the groups must be within the cross product group. These groups furnish the "labels" of the matrix report.
At least one group must be a "cell" group; that is, it must provide the information related to the labels. The values from this group fill the cells created by the matrix.
These requirements can be seen in the preceding example. It contains four groups--one group supplies the vertical labels (department numbers) and one group supplies the horizontal labels (job identifiers). These two groups are the children of the third group, called the cross product group, which creates the grid. The fourth group provides the values that fill in the grid.
Matrix reports are different from tabular reports because the number of columns is not known in advance; that is, the number of columns in your report is not determined by the number of columns you specify in your SELECT statement plus the columns you create yourself. The number of columns in your report depends on the number of values contained in the columns providing the horizontal and vertical labels. Thus, the report would automatically be extended if a new job function, called RECEPTIONIST, was added to the underlying data tables.
The queries used to select data for these sample matrix reports are not intended as definitive examples of matrix queries. If you are concerned with performance issues, for example, there are alternate methods of querying data that can improve the performance of a matrix report.
You can create matrix reports with any number of queries. Section 25.2, "Create a single-query matrix" explains how to create the matrix report using one query. Section 25.3, "Create a multiple-query matrix" explains how to create the same report using three queries. These two methods yield the same results. They are presented as options; feel free to try both methods and settle on a favorite.
This report uses the matrix layout style. You'll modify some default settings to ensure that the column and row labels display correctly. You'll also modify some field widths to ensure that the fields fit across the page.
For additional conceptual information, see Section 1.3.7, "About matrix reports",
Example Scenario
In this example, you will create report that cross tabulates salaries by job function and department. The result would be a matrix with job functions listed across the top, departments down the side, and sums of salaries in the cells. Thus, you could quickly determine the sum of all of the salaries for clerks in department 20 and compare that value to the one for all clerks in some other department.
As you build this example report, you will:
Add summaries to the single-query matrix for rows and columns.
Add a grid to add grid lines around cells.
To see a sample matrix report, open the examples folder named matrix, then open the Oracle Reports example named matrix1qb.rdf. For details on how to access it, see "Accessing the Example Reports" in the Preface.
To build the example in this chapter, you must have access to the SCOTT sample schema provided with the Oracle Database. If you do not know if you have access to this sample schema, contact your database administrator.
You can build a matrix report with a single query in the data model. A single-query data model typically performs better than a multiple-query data model.
When you are creating a single-query report, such as this one, you can use the Report Wizard to create the data model and layout simultaneously.
To create a data model and layout:
Launch Reports Builder (or, if already open, choose File > New > Report).
In the Welcome or New Report dialog box, select Use the Report Wizard, then click OK.
If the Welcome page displays, click Next.
On the Report Type page, select Create Paper Layout Only, then click Next.
On the Style page, type a Title for your report, select Matrix, then click Next.
On the Data Source page, click SQL Query, then click Next.
On the Data page, enter the following SELECT statement in the Data Source definition field:
SELECT DEPTNO, JOB, SUM(SAL)
FROM EMP
GROUP BY DEPTNO, JOB
ORDER BY DEPTNO, JOB
|
Note: You can enter this query in any of the following ways:
|
Click Next.
|
Note: If you are not already connected to a database, you will be prompted to connect to the database when you click Query Builder or Next. Ensure that you connect to a database that has the appropriate schema for this example. Section 25.1, "Prerequisites for this example" describes the sample schema requirements for this example. |
On the Rows page, click DEPTNO and click the right arrow (>) to move this field to the Matrix Row Fields list, then click Next.
On the Columns page, click JOB and click the right arrow (>) to move this field to the Matrix Column Fields list, then click Next.
On the Cell page, click SUM_SAL and click the right arrow (>) to move this field to the Matrix Cell Fields list, then click Next.
|
Note: In this case, the query itself performs the summary through theSUM function. Hence, you should not use the Sum button in this instance.
|
On the Totals page, click Next.
On the Labels page, delete the labels for all of the fields, then click Next.
On the Template page, make sure Beige is selected under Predefined Template, then click Finish to display your report output in the Paper Design view. It should look like this:
Figure 25-2 Paper Design view for the matrix report

You can build a matrix report with multiple queries in the data model. A multiple-query data model is typically easier to conceptualize and code than a single-query, but the single-query data model typically performs better.
In this case, it is easier to create the data model and layout separately. Hence, we will create an empty report first, then add the queries, and then create the layouts.
To create a blank report:
Choose File > New > Report.
Select Build a new report manually, then click OK.
When you create a report with multiple queries, it is typically easier to create all of the queries with the Data Wizard first and then create the layouts with the Report Wizard.
To create the queries:
In the Data Model view, choose Insert > Query to display the Data Wizard.
If the Welcome page displays, click Next.
On the Query page, type Q_Dept for the Query name, then click Next.
On the Data Source page, click SQL Query, then click Next.
On the Data page, enter the following SELECT statement:
SELECT DISTINCT DEPTNO
FROM EMP
|
Tip: If you click Query Builder, you can build the query without entering any code manually. |
Click Next.
|
Note: If you are not already connected to a database, you will be prompted to connect to the database when you click Query Builder or Next. Ensure that you connect to a database that has the appropriate schema for this example. Section 25.1, "Prerequisites for this example" describes the sample schema requirements for this example. |
On the Groups page, click Next.
Click Finish to display your first query in the Data Model view.
Repeat the steps above for a second query, but this time name your query Q_Job and use the following SELECT statement:
SELECT DISTINCT JOB
FROM EMP
Again, repeat the steps above for a third query, but this time name your query Q_Matrix and use the following SELECT statement:
SELECT DEPTNO, JOB, SUM(SAL)
FROM EMP
GROUP BY DEPTNO, JOB
ORDER BY DEPTNO, JOB
Figure 25-3 Three query data model, queries unrelated
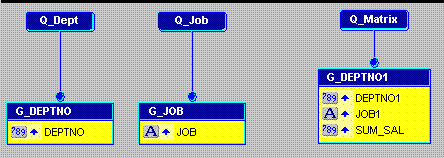
To create the cross product group:
In the Data Model view, click the Cross Product tool in the tool palette.
Drag a box around G_DEPTNO and G_JOB. When you release the mouse button, the cross product group is created. Ensure that it completely surrounds both groups.
Figure 25-4 Three query data model with cross product group
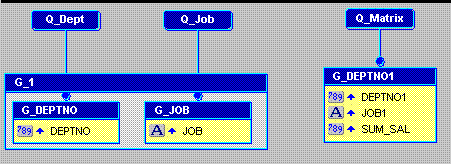
To add the data link:
In the Data Model view, click the Data Link tool in the tool palette.
Click and drag from the DEPTNO column in the G_DEPTNO group to the DEPTNO1 column in the G_DEPTNO1 group.
Repeat steps 1 and 2, but this time drag the link between the JOB column in G_JOB and JOB1 in G_DEPTNO1.
Figure 25-5 Three query data model with cross product group and data links
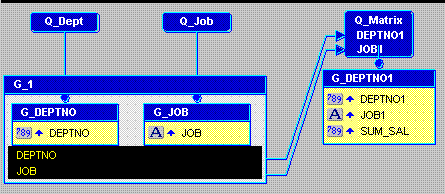
Once your data model is complete, you need to create a layout for the data objects to display in the report output.
To create the layout:
In the Data Model view, right-click on the canvas, then choose Report Wizard.
In the Report Wizard, on the Report Type page, select Create Paper Layout only.
On the Style page, select Matrix.
On the Groups page, ensure that all of the groups from your data model appear in the Displayed Groups list. G_1 should be Matrix, G_DEPTNO should be Down, G_JOB should be Across, and G_DEPTNO1 should be Down.
Figure 25-6 Groups page of the Report Wizard
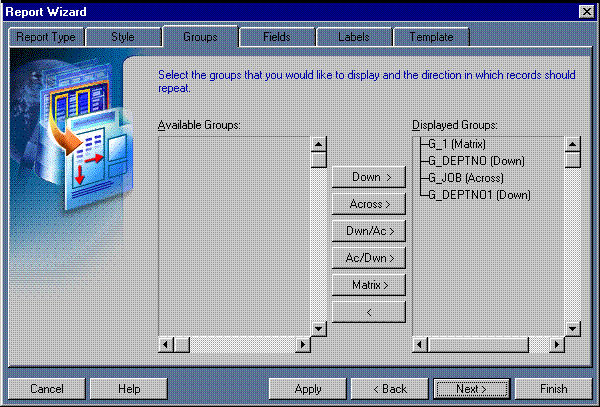
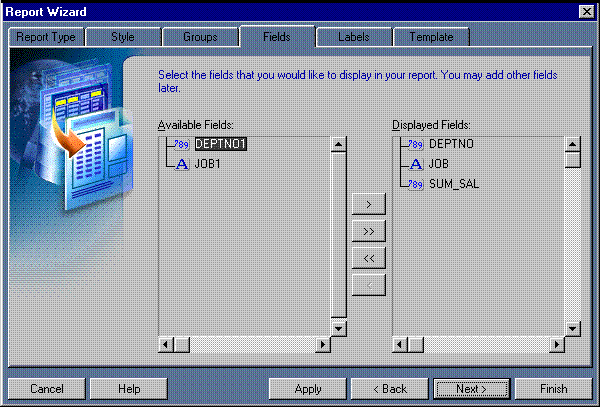
On the Fields page, ensure that only the following columns appear in the Displayed Fields list:
DEPTNO
JOB
SUM_SAL
Figure 25-7 Fields page of the Report Wizard
On the Labels page, delete the labels for all of the fields.
On the Template page, make sure Beige is selected under Predefined Template, then click Finish to display your report output in the Paper Design view. It should look like this:
Figure 25-8 Paper Design view for the matrix report

To make your matrix report more useful, you should add summaries of each row and column in the matrix, and the whole report. In the single-query case, you can add these summaries very easily with the Report Wizard. In the multiquery case, you would need to add the summaries manually and then use the Report Wizard to create fields for them.
The steps below describe the procedure for adding summaries to the single-query matrix.
To add summaries to a single-query matrix:
Return to the Report Wizard by choosing Tools > Report Wizard.
|
Note: Although you can use the Report Wizard to add summaries to a single-query matrix, you cannot use this method for a multiquery matrix. |
On the Report Type page, select Create Paper Layout only.
On the Totals page, click SUM_SAL in the Available Fields list, then click Sum.
|
Tip: You may have to use the arrows to make the Totals tab visible. |
Click Finish to preview your report output in the Paper Design view.
|
Note: When your new layout is created, you should notice a couple of things. First, at the bottom of each column of the matrix, you should now see a summary of that column's values. The report is also probably more than one page long now. Because of the width of the layout, the summaries for the departments cannot fit on the page with the rest of the matrix. Hence, the department summaries and the report summary overflow to the next page. Go to the second page of the report and you will see the department summaries and the report summary. |
To make your report easier to read, you can add formatting to the monetary values.
To format monetary values:
On the first page of the report, click one of the cell values. Notice that all of the values are immediately selected, indicating that you can change their properties simultaneously.
Shift-click one of the summary values at the bottom of a column of the matrix.
Click the Currency button in the toolbar. A currency symbol immediately appears next to all of the values.
Click the Add Decimal Place button in the toolbar twice. Two decimal places are added to the right of the decimal point.
Resize the fields. Click and drag the rightmost handle of the cell value under the SALESMAN label about 0.5 inches (1.5 centimeters) to the left. After you complete this operation, the department summaries from the second page should move onto the first page.
Shift-click the SALESMAN label.
Click the Align Right button in the toolbar.
Click in an open area of the Paper Design view to deselect all of the objects.
Click one of the department summaries at the end of a row in the matrix. All of the department summaries are immediately selected.
Shift-click the report summary underneath the department summaries.
Use the left arrow key to move these summaries to the left until they are approximately flush with the SALESMAN column in the matrix.
Click the Currency button in the toolbar. A currency symbol immediately appears next to all of the values.
Click the Add Decimal Place button in the toolbar twice. Two decimal places are added to the right of the decimal point.
Resize the fields. Click and drag the rightmost handle of one of the selected fields about 0.5 inches (1.5 centimeters) to the left.
Click the Align Right button in the toolbar.
Figure 25-9 Matrix report in Paper Design view with monetary values formatted

A matrix report displays a juxtaposition of data – in other words, the values held in common by two different categories of data. These categories are indicated by the row and column labels.
The matrix displays this juxtaposition of values using a grid-like format. If the two categories have nothing in common, the grid at that point is empty. The matrix appears to be full of "holes". You can fill the holes using boilerplate text.
|
Note: Do not confuse empty spaces in the grid with null values. A null value is an actual value fetched from the database. The spaces in a matrix report are empty because nothing has been fetched to fill them. |
To replace blanks with zeroes:
Open the matrix report to which you previously added the summaries.
In the Object Navigator, double-click the view icon next to the Paper Layout node to display the Paper Layout view.
|
Tip: The steps that follow require some precision in the placement of objects. Hence, you may want to magnify the view to make the process easier. Click the Magnify tool and then click somewhere in the Paper Layout view. Repeat as many times as necessary. |
In the Paper Layout view, click the Confine On and Flex On buttons in the toolbar to turn both modes on.
From the font lists in the toolbar, choose Arial (Western), point size 10.
Click the Align Right button in the toolbar.
Click the Text tool in the tool palette.
Click the top of the F_SUM_SAL field about 0.75 inches (2 centimeters) from its right edge. Your objective is to create an object right on top of F_SUM_SAL.
Type the following:
$0.00
Click in an open area of the layout to deselect all objects.
In the Object Navigator, type B_1 in the Find field. You will be taken to the object you just created. If you are viewing the Object Navigator in Ownership View (View > Change View > Ownership View), you should see B_1 underneath R_G_SUM_SAL and on the same level as F_SUM_SAL.
|
Tip: If B_1 does not appear underneath R_G_SUM_SAL, return to the Paper Layout view, delete B_1 and try again. |
Figure 25-10 Object Navigator with new object selected
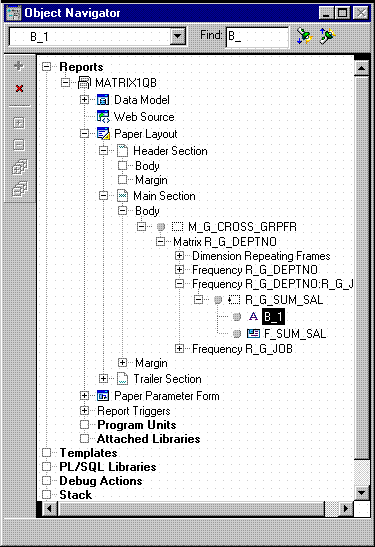
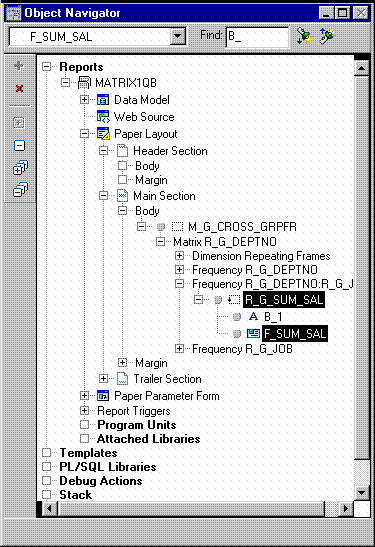
Click R_G_SUM_SAL and then ctrl-click F_SUM_SAL so that they are both selected and B_1 is deselected.
Figure 25-11 Object Navigator with repeating frame and field selected
Click the title bar of the Report Editor to make it the active window.
Click the Confine Off button in the toolbar to turn Confine mode off.
Choose Layout > Move Forward.
|
Tip: After this operation, B_1 should appear just above R_G_SUM_SAL, as a peer rather than a child of R_G_SUM_SAL. If B_1 is still appearing as a child under R_G_SUM_SAL, repeat steps 11 through 14 until it is no longer appearing as a child of R_G_SUM_SAL. |
In the Paper Layout view, click the Confine On button in the toolbar to turn Confine mode back on again.
Click the Paper Design button in the toolbar to display the Paper Design view.
|
Tip: If the $0.00 is not quite aligning with the other monetary values around it, select it and use the arrow keys to move it to the desired location. |
Figure 25-12 Matrix report output with zeroes replacing blanks

Sometimes matrix reports are easier to read when they have grid lines that divide the cells from each other. For most objects, No Line is the default setting. To add grid lines, all you need to do is select the appropriate objects and give them a line color.
To add grid lines
Open the matrix report which you previously modified to show zeroes instead of blanks.
In the Object Navigator, double-click the view icon next to the Paper Layout node to display the Paper Layout view.
In the Object Navigator, choose View > Change Views > Object Type View.
Select all of the following objects in the Object Navigator under the Paper Layout node using Ctrl-click:
F_SUMSUM_SALPERDEPTNO
F_SUMSUM_SALPERJOB
F_SUMSUM_SALPERREPORT
F_SUM_SAL
B_1
Click the title bar of Paper Layout view to make it the active window.
In the Paper Layout view, click the Line Color tool in the tool palette, and click a block that shows the color black.
Click the Paper Design button in the toolbar to display the Paper Design view. You should now see a grid around all of the cells in your matrix.
Figure 25-13 Matrix report output with a grid

Save your report as matrix1qb_your_initials.rdf
Congratulations! You have successfully created a matrix report. You now know how to:
create a matrix report with a single-query data model.
create a matrix report with a multiple-query data model.
add summaries and format monetary values.
substitute zeroes for blanks in a matrix layout.
add a grid.
For more information on any of the wizards, views, or properties used in this example, refer to the Oracle Reports online Help, which is available in Reports Builder or hosted on the Oracle Technology Network (OTN), as described in Section 3.1.1, "Using the Oracle Reports online Help".