|
Oracle® Reports Building Reports
10g Release 2 (10.1.2) B13895-01 |
|
 Previous |
 Next |
|
Oracle® Reports Building Reports
10g Release 2 (10.1.2) B13895-01 |
|
 Previous |
 Next |
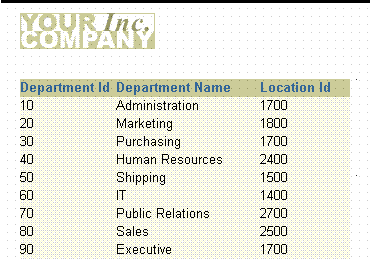
In this chapter, you will learn about master/master reports. By following the steps in this chapter, you can generate the report output shown in Figure 8-1.
Figure 8-1 Master/Master report output

Concepts
A master/master report displays at least two sets of data that are not directly related—that is, the records constituting the data are fetched using at least two separate queries. A master/master report (also called a parent/parent report) contains two or more queries with no links (parent/child relationships).
Data Relationships
Although the data may be conceptually related, the queries make no attempt to relate it by the manner in which it is fetched. To select the data for a master/master report, you create two or more unrelated queries. Reports Builder will create all other necessary data objects by default.
Layout
This report uses the default tabular layout style. You will move the layout objects associated with the second query to insert more space between the information fetched by the two queries and make your report easier to read.
Example Scenario
In this example, you will create a master layout that lists department names, numbers, and locations followed by another master layout that lists all employees with their job, titles, and salaries.
As you build this example report, you will:
Format a field to format monetary values.
To see a sample master/master report, open the examples folder named masterb, then open the Oracle Reports example named masterb.rdf. For details on how to access it, see "Accessing the Example Reports" in the Preface.
To build the example in this chapter, you must have access to the Human Resources sample schema (HR) provided with the Oracle Database. If you do not know if you have access to this sample schema, contact your database administrator.
In this case, it is easier to create the data model and layout separately. Hence, we will create an empty report first, then add the queries, and then create the layouts.
To create a blank report:
Launch Reports Builder (or, if already open, choose File > New > Report)
In the Welcome or New Report dialog box, select Build a new report manually, then click OK.
When you create a report with multiple queries, it is typically easier to create all of the queries with the Data Wizard first and then create the layouts with the Reports Wizard.
To create the queries:
In the Data Model view, choose Insert > Query to display the Data Wizard.
If the Welcome page displays, click Next.
On the Query page, type Q_Dept for the Query name and click Next.
On the Data Source page, click SQL Query, then click Next.
On the Data page, enter the following SELECT statement in the Data Source definition field:
SELECT DEPARTMENT_ID, DEPARTMENT_NAME, LOCATION_ID
FROM DEPARTMENTS
|
Note: You can enter this query in any of the following ways:
|
Click Next.
|
Note: If you are not already connected to a database, you will be prompted to connect to the database when you click Query Builder or Next. Ensure that you connect to a database that has the appropriate schema for this example. Section 8.1, "Prerequisites for this example" describes the sample schema requirements for this example. |
On the Groups page, click Next.
Click Finish to display the data model for your report in the Data Model view.
Repeat the steps above for a second query, but this time name your query Q_Emp and use the following SELECT statement:
SELECT LAST_NAME, FIRST_NAME, JOB_ID, SALARY
FROM EMPLOYEES
ORDER BY LAST_NAME, FIRST_NAME
Figure 8-2 Data model with two unrelated queries
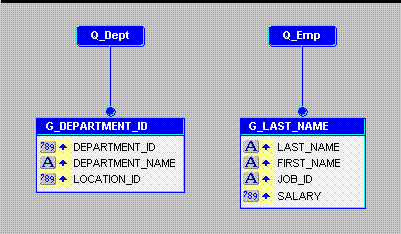
Once your data model is complete, you need to create a layout for the data objects to display in the report output. The Report Wizard enables you to create layouts for your data model.
|
Tip: When you have multiple queries in your data model, make sure that you check the names of the groups associated with each query prior to entering the Report Wizard. The Report Wizard requires you to choose data for the layout by group name. |
To create the layout:
In the Data Model view, right-click on the canvas, then choose Report Wizard.
In the Report Wizard, on the Report Type page, select Create Paper Layout only.
On the Style page, select Tabular.
On the Groups page, ensure that both groups from your data model appear in the Displayed Groups list.
On the Fields page, click the double right arrows (>>) to move all of the fields to the Displayed Fields list.
On the Template page, select Predefined Template and click Beige, then click Finish to display your report output in the Paper Design view. The output for the Department report should look something like this:
Figure 8-3 Paper Design view for the Master/Master report
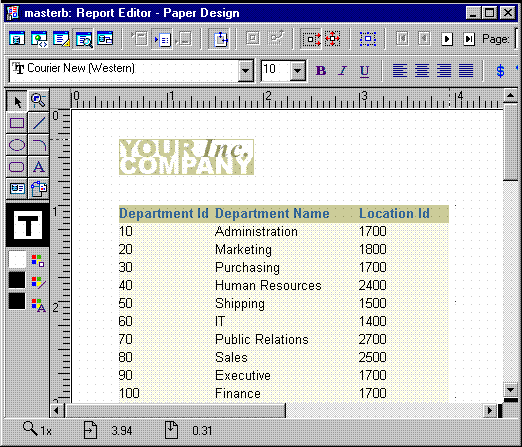
If you scroll down in the Paper Design view, you will notice that the field labels from the second query, Q_Emp, are located directly below the fields from the first query, Q_Dept. In fact, they are almost touching each other. For this report, you will move all of the layout objects belonging to Q_Emp down the page to create some white space between the two layouts.
To create white space between the layouts:
Move and resize the Report Editor window such that you can easily view it and the Object Navigator simultaneously.
Click the Paper Layout button in the toolbar of the Report Editor window to display the Paper Layout view.
In the Object Navigator, expand the Paper Layout node, then the Main Section node, then the Body node.
Click the frame named M_G_LAST_NAME_GRPFR. Note that it is also now selected in the Paper Layout view.
Click the title bar of the Report Editor to make it the active window.
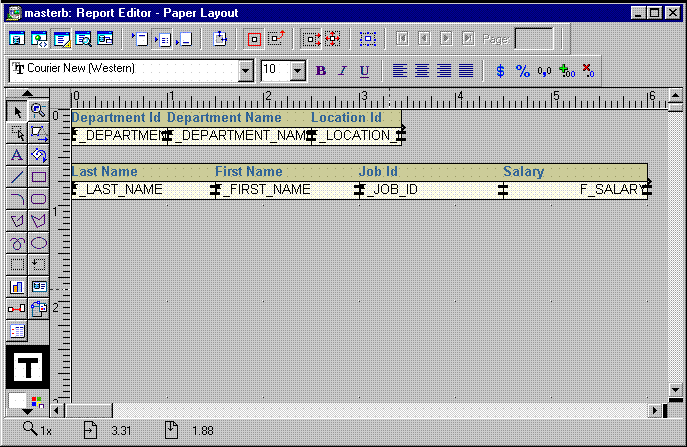
Press the down arrow key a few times to move the frame and all of its objects down the page about 0.25 inches (0.5 centimeters).
Notice that you have moved not only M_G_LAST_NAME_GRPFR but also all the layout objects within it. Here you take advantage of Confine mode, the default mode for the Paper Layout view. With Confine mode on, an object cannot be moved outside of or placed behind its parent. Such a situation renders the layout invalid and no output is produced.
Sometimes moving an object outside of its parent is a valid action. If you need to do so, you can turn off Confine mode by clicking the Confine Off button in the toolbar.
Figure 8-4 Paper Layout view with two layouts and white space added
Save the report as masterb_your_initials.rdf.
Click the Paper Design button in the toolbar to preview your output again. Notice the additional space between the two layouts now.
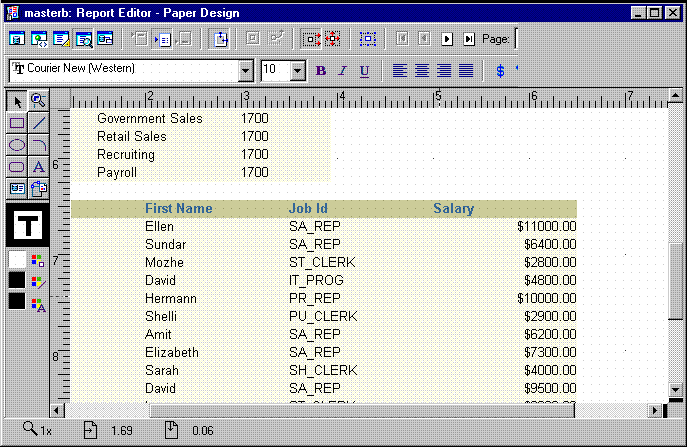
In the Paper Design view, notice the Salary field. The values are neither aligned nor displayed as monetary amounts. You can quickly rectify this in the Paper Design view.
To assign a format mask to monetary values:
In the Paper Design view, select the first number value underneath the Salary label in the second layout. Notice that all of the values are immediately selected, indicating that you can change their properties simultaneously.
|
Tip: If you are familiar with format mask syntax, you could now right-click the field values, choose Property Inspector, and choose or manually type a value for the Format Mask property. |
Click the Currency button in the toolbar. A currency symbol immediately appears next to all of the values.
Click the Add Decimal Place button twice. Two decimal places are added to the right of the decimal point.
Click the Align Right button. All of the values are immediately right aligned.
Save your report.
Figure 8-5 Paper Design view with monetary values formatted
Congratulations! You have successfully created a master/master report. You now know how to:
create queries with the Data Wizard.
layout the data with the Report Wizard.
create white space in the Paper Layout view.
format fields in the Paper Design view.
For more information on any of the wizards, views, or properties used in this example, refer to the Oracle Reports online Help, which is available in Reports Builder or hosted on the Oracle Technology Network (OTN), as described in Section 3.1.1, "Using the Oracle Reports online Help".