|
Oracle® Reports Building Reports
10g Release 2 (10.1.2) B13895-01 |
|
 Previous |
 Next |
|
Oracle® Reports Building Reports
10g Release 2 (10.1.2) B13895-01 |
|
 Previous |
 Next |
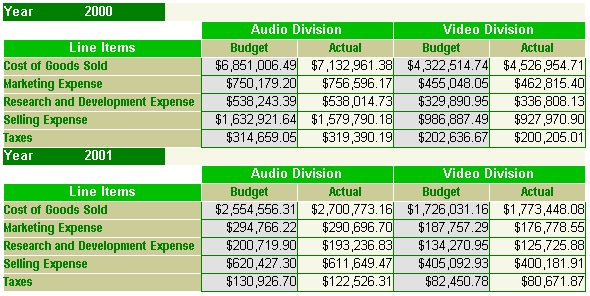
In this chapter, you will learn about reports that include data from an Online Analytical Processing (OLAP) pluggable data source (PDS), which is provided with Oracle Reports. By following the steps in this chapter, you can generate the report output shown in Figure 46-1.
Figure 46-1 Report output using an OLAP PDS

Concepts
The information you must publish is often derived from data in various corporate data sources. These data sources may be SQL-based (relational databases) or non-SQL-based, such as XML, and OLAP. Often, you must combine data from one or more of these data sources to publish meaningful information. For example, you may need to combine data that exists in a relational database with data from a multidimensional database to compare trends and performance.
Oracle Reports enables you to leverage capabilities, such as aggregation, summarization, formatting, and scheduling, on data from any data source. You can leverage the pluggable data source (PDS) architecture to connect to your own data source, as well as to the data sources available with Oracle Reports (XML, JDBC, Text, and OLAP).
The OLAP option is an integrated part of the Oracle Database. The OLAP option to Oracle Database 10g is designed to complement relational technology of the Oracle database by enhancing the database's calculation capabilities. The OLAP option provides support for:
Complex, user-defined multidimensional calculations
Planning functions
Transaction model designed for what-if analysis
This OLAP option provides two basic services: a calculation engine and an OLAP API. For more information, refer to the OLAP PDS section of the Oracle Reports online Help.
For more information on pluggable data sources, refer to the Oracle Reports online Help. If your data source cannot use an existing PDS, the PDS API enables you to write your own PDS and incorporate it into Oracle Reports to access your own unique data sources. The API is documented in Oracle Reports Java API Reference, available on the Oracle Technology Network Oracle Reports Documentation page ().
Example Scenario
OLAP applications span a variety of organizational functions. Finance departments use OLAP for applications such as budgeting, activity-based costing (all locations), financial performance analysis, and financial modeling. Among other applications, marketing departments use OLAP for market research analysis, sales forecasting, promotions analysis, customer analysis, and market/customer segmentation. Typical manufacturing OLAP applications include production, planning, and defect analysis. Sales analysis and forecasting are two OLAP applications found in the sales departments.
In this example, you will focus on the usage of OLAP in a finance department. You will learn how to create a report for paper layout based on OLAP data to compare budgeted versus actual costs incurred for the period 2000 and 2001.
As you build this example report, you will:
Create a new report based on OLAP data using the Report Wizard:
Define the OLAP data source connection in the Connection Editor in the Connect OLAP data source dialog box.
Specify connection details in the OLAP Connection tabbed page.
Define the query to access OLAP data using the Query Wizard.
Specify row, column, and cell field details for a matrix report using the Report Wizard.
To see a sample report that uses an OLAP PDS, open the examples folder named OLAPPDS, then open salesolap.rdf. For details on how to open it, see "Accessing the Example Reports" in the Preface. The example files used in this chapter are listed and described in Table 46-1.
Table 46-1 Example report files
| File | Description |
|---|---|
|
|
The final output PDF of the paper report. |
|
|
The final definition file, RDF version, of the paper report. |
To build the example in this chapter, you must have the example files we have provided (see "Example Scenario", above), as well as access to a separate BIBDEMO schema that is provided by Oracle Database. If you do not know if you have access to this sample schema, contact your database administrator. You should have access to this schema that contains OLAP data to complete this example. Typically, you can log in to this schema by using the user ID and password "bibdemo/bibdemo", then enter the name of the database.
If not available, you can install this sample BIBDEMO schema from the Oracle Business Intelligence Beans documentation page of the Oracle Technology Network (http://www.oracle.com/technology/documentation/bib.html) by searching for "Installing the Demo Schema".
When you create a report, you can either use the Report Wizard to assist you or create the report manually. In this example, you will use the Report Wizard to create a report layout for paper based on OLAP data.
When creating the OLAP query, you must have access to BIBDEMO provided by Oracle that contains OLAP data, as described in Section 46.1, "Prerequisites for this example".
To create a simple report:
Launch Reports Builder (or, if already open, choose File > New > Report).
In the Welcome or New Report dialog box, choose Report Wizard, then click OK.
If the Welcome page displays, click Next.
On the Report Type page, make sure that Create Paper Layout only is selected, then click Next.
On the Style page, type a title for your report if needed, then select Matrix with Group. Due to the multidimensional nature of OLAP data, it is best displayed in a matrix report.
Click Next.
On the Data Source page, click OLAP Query.
Click Next.
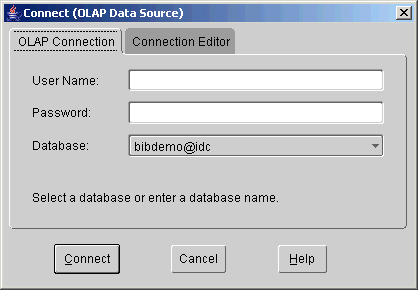
You will define the connection using the Connection Editor. When you click Query Definition on the Data Source Definition page, the Connect (OLAP Data Source) dialog box displays.
Figure 46-2 Connect (OLAP Data Source) dialog box

You must specify the connection information for your OLAP data source before you connect to it. The steps in this section show you how to specify the description, host name, port number, and SID connection information that will be used to connect to your OLAP data source.
To specify the connection information for your OLAP data source:
In the Connect (OLAP Data Source) dialog box, click the Connection Editor tab to specify the connection details.
On the Connection Editor tab page, click New to enter the connection information for your OLAP data source.
Ensure that in this tab page, you include a descriptive name for your connection, name of the host, port number, and SID details in the following fields:
Description
Host Name
Port Number
SID
|
Tip: Use meaningful description definitions. If you define more than one connection, the definition of the description field is used to populate the list that displays available connections. |
Click Save to store the definition of the new connection.
|
Note: If you do not click Save, you will be prompted to save your new definition when you click the OLAP Connection tab to continue. |
Once you specify the connection information in the Connect (OLAP Data Source) dialog box, you connect to your OLAP data source by using the OLAP Connection tab in the same dialog box.
The steps in this section show you how to specify the user name, password, and database details that you can use to connect to your OLAP data source.
To specify the OLAP connection details:
In the Connect (OLAP data source) dialog box, click OLAP Connection.
On this page, enter the user information to connect to your OLAP data source. Type the user name and password details in the fields as follows:
User Name: bibdemo
Password: bibdemo
The Database list contains the list of available connections. Choose your OLAP data source connection from this list (for example, myolapconnection), and click Connect.
Once you are connected to your OLAP data source, you create the query. The steps in this section show you how to define your query on the OLAP data.
To define the OLAP query:
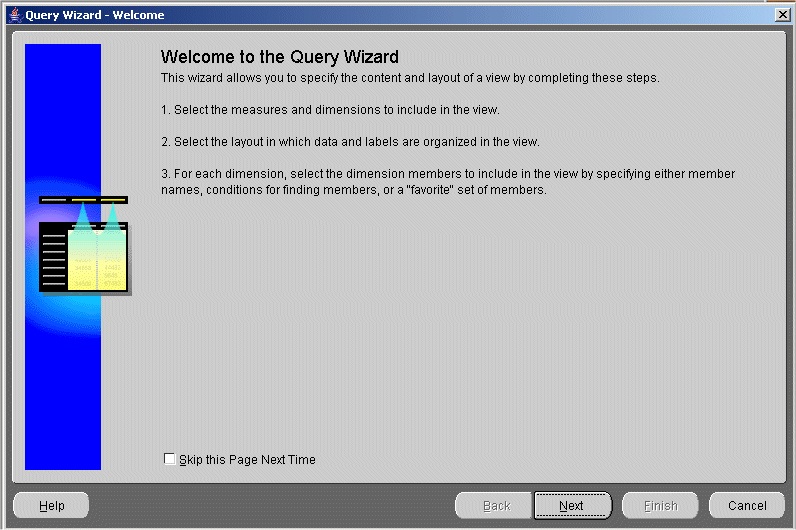
In the Query Editor, if the Welcome to the Query Wizard page displays, click Next.
Figure 46-5 OLAP Query Wizard Welcome page

The Items page displays. Here, you can add items to the query. Click (+) next to Financial data to expand the heading.
On the Items page, choose Actual in the Available list and click Add selected items (>) to move this field to the Selected list.
|
Note: Ensure that Automatically add/remove dimensions check box is selected. All the three associated dimensions: Division, Line Items, and Time get selected automatically. |
On the Items page, choose Budget in the Available list and click Add selected items (>) to move this field to the Selected list.
Click Next. The Choose Divisions page displays.
On the Choose Divisions page:
Click Audio Division in the Available list and click Add selected items (>) to move this field to the Selected list.
Click Video Division in the Available list and click Add selected items (>) to move this to the Selected list.
Click Next. The Choose Lines page displays.
On the Choose Lines page, choose each of the following items in the Available list and click Add selected items (>) to move this to the Selected list:
Cost of Goods Sold
Marketing Expense
Research and Development Expense
Selling Expense
Taxes
Click Next. The Choose Times page displays.
On the Choose Times page:
Choose 2000 in the Available list and click Add selected items (>) to move this to the Selected list.
Choose 2001 in the Available list and click Add selected items (>) to move this to the Selected list.
Click Finish.
When you finish defining the data for your report by creating the query, you must complete building the report itself. The steps in this section show you how to define the row, column, and cell fields for your matrix report.
To complete building the matrix report based on OLAP data:
On the Data Source Definition page of the Report Wizard, the database connection details such as Host name, SID, and Port number are displayed.
The selected measures, Actual and Budget, and selected dimensions such as Time, Line Items, and Division are also displayed on this page.
Click Next.
On the Groups page, choose Time in the Available Fields list and click the right arrow (>) to move this field to the Matrix Group Fields list.
Click Next.
On the Rows page, choose Line_Items in the Available Fields list and click the right arrow (>) to move this field to the Matrix Row Fields list, then click Next.
On the Columns page, choose Division in the Available Fields list and click the right arrow (>) to move this field to the Matrix Column Fields list, then click Next.
On the Cell page:
Choose Budget in the Available Fields list and click the right arrow (>) to move this field to the Matrix Cell Fields list.
Choose Actual in the Available Fields list and click the right arrow (>) to move this field to the Matrix Cell Fields list.
Click Next.
On the Totals page, click Next.
On the Labels page, change the labels and field widths as follows:
Click Next.
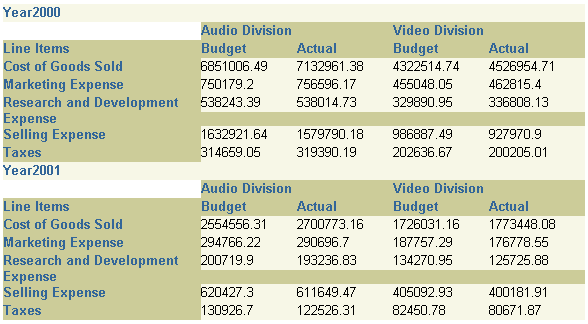
On the Template page, ensure that Predefined template is selected, then click Finish to display your report output in the Paper Design view. It should look something like this:
Figure 46-10 Output of matrix report based on OLAP data

Save your report as salesolap_your_initials.rdf.
The only task that remains now is to improve the readability of your report.
To format the report:
In the Paper Design view, Shift-click to select the Year and 2000 labels.
Click the Fill Color tool in the tool palette and select dark green.
Click the Text Color tool and select white.
Click on the canvas to deselect the labels.
Click the Align Center button in the toolbar.
Shift-click the Line Items and Audio Division labels to select both of them.
Click the Fill Color tool in the tool palette and select light green.
Click the Text Color tool and select white.
Click the Line Color tool and select white.
Click the Align Center button in the toolbar to center align all the header labels.
Shift-click the Budget and Actual labels to select them too.
Click on the canvas to deselect the labels.
Select the Cost of Goods Sold, Budget, and Actual labels.
Select Arial Narrow from the Font list in the toolbar.
Click the Text Color tool in tool palette and select dark green.
Click on the canvas to deselect the labels.
Click the Line Color tool and select white.
Shift-click the numeric values underneath the Budget and Actual labels.
Click the Align Right button in the toolbar. All the values are immediately right aligned.
Click the Currency button in the toolbar. A currency symbol immediately appears next to all the values.
Click the Commas button in the toolbar. Commas immediately appear in all the values.
Click the Add Decimal Place button twice. Two decimal places are added to the right of the decimal point.
Click the Line Color tool in the tool palette and select dark green.
Shift-click the values under the Actual label to deselect them. Now, only the values under Budget should be selected.
Click the Fill Color tool in the tool palette and select light gray.
Your report should look something like this.
Figure 46-11 Paper Design view of the report with formatting

To run your paper report:
In the Object Navigator, make sure your report (salesolap_your_initials.rdf) is selected.
Click the Run Paper Layout button in the toolbar to run your report to paper.
Your report displays in the Paper Design view, and should look something like this:
Figure 46-12 Final Paper Design view of the OLAP PDS example report

Save the report.
Congratulations! You have successfully used an OLAP data source for a paper report. You now know how to:
create a report for paper based on OLAP data using the Report Wizard.
define the connection using the Connection Editor in the Connect (OLAP Data Source) dialog box.
enter the connection details using the OLAP Connection tabbed page in the Connect (OLAP Data Source) dialog box.
define the OLAP query using the Query Wizard.
complete the report definition using the Report Wizard.
For more information on any of the wizards, views, or properties used in this example, refer to the Oracle Reports online Help, which is available in Reports Builder or hosted on the Oracle Technology Network (OTN), as described in Section 3.1.1, "Using the Oracle Reports online Help".