|
Oracle® Reports Building Reports
10g Release 2 (10.1.2) B13895-01 |
|
 Previous |
 Next |
|
Oracle® Reports Building Reports
10g Release 2 (10.1.2) B13895-01 |
|
 Previous |
 Next |
In this chapter, you will learn about reports that include PL/SQL. By following the steps in this chapter, you can generate the report output shown in Figure 39-1.
Concepts
There are a variety of ways to incorporate PL/SQL into your reports. You have already created formula columns that used simple PL/SQL expressions to compute their values, and format triggers that used PL/SQL to conditionally determine the formatting of mailing labels. Here, you will create external libraries and local functions and procedures.
External PL/SQL libraries are modules that contain named PL/SQL functions and procedures. They may be stored either in the database or in a file, and can be referenced from not only any report, but from other Oracle products. External libraries eliminate the need to re-enter commonly-used PL/SQL constructs, whether in reports, forms, or graphs. This, in turn, eliminates the problem of maintaining several versions of the same PL/SQL code.
Local PL/SQL consists of named PL/SQL functions and procedures that are saved in a report definition. Local PL/SQL may be referenced only by objects within the report (for example, group filters, formula columns, format triggers, and so on). However, the usefulness of storing PL/SQL in a single location still applies.
Data Relationships
This report uses one query. You will add a function stored in an external library, a report-level function, two formula columns, and a parameter governing the number of records to display before inserting a space.
Layout
This report uses the tabular layout style, with minor modifications.
Example Scenario
In this example, you will use an external PL/SQL library and PL/SQL within a report to modify formatting to add spacing between records, and calculate the total compensation for each employee. You will manually create a query in the Data Model view, then modify the layout of the report in the Paper Layout view. You will create formula columns, a summary column, and a format trigger that uses a summary column and a user parameter.
As you build this example report, you will:
Create a new PL/SQL library that you will use in this report.
To see a sample PL/SQL report, open the examples folder named plsql, then open the Oracle Reports example named plsql.rdf. For details on how to open it, see "Accessing the Example Reports" in the Preface.
To build the example in this chapter, you must have access to the Human Resources sample schema (HR) provided with the Oracle Database. If you do not know if you have access to this sample schema, contact your database administrator.
The steps in this section will show you how to create a new PL/SQL library, then create a function that will live in this library.
To create the library:
Launch Reports Builder (or, if already open, choose File > New > Report).
In the Welcome or New Report dialog box, select Build a new report manually, then click OK.
In the Object Navigator, choose File > New > PL/SQL Library.
A new library displays in the Object Navigator below your report name, under the PL/SQL Libraries node.
If it is not already expanded, expand the node of the new library to show the two subnodes: Program Units and Attached Libraries.
Click the Program Units node, then choose Edit > Create.
In the New Program Unit dialog box, in the Name field, type BONUS_PAY.
Select Function, then click OK to display the PL/SQL Editor.
In the PL/SQL Editor, use the template to enter the following PL/SQL code:
FUNCTION BONUS_PAY(JOB_ID IN CHAR, SAL IN NUMBER, COMM_PCT IN NUMBER) RETURN NUMBER IS
BEGIN
  IF JOB_ID != 'SA_REP' THEN
    RETURN (SAL * 0.15);
  ELSE
    IF SAL * COMM_PCT >= 500 THEN
      RETURN ((SAL + SAL * COMM_PCT) * 0.15);
    ELSE
       RETURN ((SAL + SAL * COMM_PCT) * 0.10);
    END IF;
  END IF;
END;
|
Note: You can enter this code by copying and pasting it from the provided text file calledplsql_code.txt.
|
Click Compile.
If there are compilation errors, match your code to the code we have provided (either in the example RDF file or in this chapter), then compile it again.
Once there are no compilation errors, click Close.
Your new function displays in the Object Navigator.
Choose File > Save to save your new function.
In the Save Library dialog box, type bonus.pll, make sure File System is selected, then click OK.
In the Object Navigator, under the MODULE1 report you have created, click the Attached Libraries node. Be sure to select this node, and not the one under the PL/SQL Libraries node.
Choose Edit > Create.
In the Attach Library dialog box, in the Library field, type bonus.pll.
|
Note: If you savedbonus.pll to another directory, you can click Browse to find it on your file system. Just make sure you have selected File System before browsing.
|
When the library name displays in the Library field, click Attach to attach the library.
|
Note: If you attach a library whose name also includes a path, Reports Builder will inform you that the path names are not portable, and will give you the option of deleting the path. If you choose to continue using a path specification, Reports Builder will only look in that specific location for the library. So, if you move the library, Reports Builder will not be able to find it. If you delete the path, Reports Builder will use a standard search path to locate the library if it is moved. |
The objects in your Object Navigator should now look something like this:
Save your report as plsqlreport_your_initials.rdf.
The steps in this section will show you how to create the query and the formula columns that will define the report and call the code in the bonus.pll external PL/SQL library you created.
We recommend that you create the objects in the order described, as some of the formula columns depend on the functions, and so on.
The steps in this section will show you how to create the query that will retrieve the data necessary for this report.
To create the query:
In the Object Navigator, double-click the view icon next to the Data Model node to display the Data Model view.
In the Data Model view, choose Insert > Query to display the Data Wizard.
If the Welcome page displays, click Next.
On the Query page, leave the default query name, then click Next.
On the Data Source page, select SQL Query, then click Next.
On the Data page, enter the following SELECT statement in the Data Source definition field:
SELECT FIRST_NAME, LAST_NAME, JOB_ID, SALARY,COMMISSION_PCT
FROM EMPLOYEES
ORDER BY LAST_NAME
|
Note: You can enter this query in any of the following ways:
|
Click Next.
|
Note: If you are not already connected to a database, you will be prompted to connect to the database when you click Query Builder or Next. Ensure that you connect to a database that has the appropriate schema for this example. Section 39.1, "Prerequisites for this example" describes the sample schema requirements for this example. |
On the Groups page, click Next.
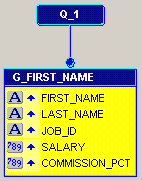
Click Finish to display your first query in the Data Model view. It should look something like this:
Figure 39-3 Data Model view of the PL/SQL report
Save your report.
The steps in this section will show you how to create a formula column that will calculate the salary bonus for each employee using the PL/SQL function.
To create the BONUS formula column:
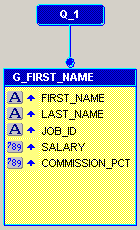
In the Data Model view, click group G_FIRST_NAME, then click the bottom resize handle and drag it down to make room in the group for more columns. Here is an example of what it should look like now:
Figure 39-4 Data Model with expanded G_FIRST_NAME
Click the Formula Column tool in the tool palette, then click in the G_FIRST_NAME group to create a formula column.
Figure 39-5 Data Model with unnamed formula column
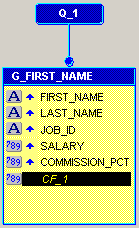
Double-click the new formula column object (CF_1) to display the Property Inspector, and set the following properties:
Under General Information, set the Name property to BONUS.
Under Placeholder/Formula, click the PL/SQL Formula property field to display the PL/SQL Editor.
In the PL/SQL Editor, use the template to enter the following PL/SQL code:
function BONUSFormula return Number is
begin
  return BONUS_PAY(:JOB_ID, :SALARY, :COMMISSION_PCT);
end;
|
Note: You can enter this code by copying and pasting it from the provided text file calledplsql_code.txt. This code is for the Bonus Formula Column.
|
Click Compile.
|
Note: If there are compilation errors, compare your code closely against the code we have provided. |
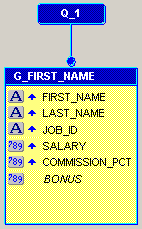
When there are no compilation errors, click Close to display the data model for your report in the Data Model view. It should look something like this:
Figure 39-6 Data Model with BONUS formula column
Save your report.
The steps in this section will show you how to write a function that returns the total compensation for each sales representative (the values of columns SALARY plus COMM plus BONUS), as well as other employees (SALARY plus BONUS).
In the Object Navigator, click the Program Units node, then choose Edit > Create.
In the New Program Unit dialog box, in the Name field, type FINAL_CALC.
Select Function, then click OK.
In the PL/SQL Editor, use the template to enter the following PL/SQL code:
FUNCTION FINAL_CALC RETURN NUMBER IS
BEGIN
  IF :JOB_ID = 'SA_REP' THEN
    	RETURN (:BONUS + :SALARY + :COMMISSION_PCT * :SALARY);
  ELSE
    	RETURN (:BONUS + :SALARY);
  END IF;
END;
|
Note: You can enter this code by copying and pasting it from the provided text file calledplsql_code.txt. This code is for Final Calc.
|
Click Compile.
When the code is compiled without errors, click Close.
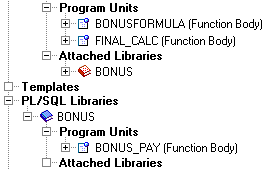
The new function, FINAL_CALC, now displays in the Object Navigator:
Figure 39-7 Object Navigator with FINAL_CALC function
Save your report.
The steps in this section will show you how to create another formula column that will calculate the total compensation. The value calculated by the report-level function FINAL_CALC will be assigned to the column TOTAL_COMP. If you are not sure how to create a formula column, refer to Section 39.3.2, "Create a formula column that calculates bonuses".
To create the TOTAL_COMP formula column:
In the Data Model view, follow the steps above to create a second formula column below the BONUS formula column.
Double-click the new formula column object (CF_1) to display the Property Inspector, and set the following properties:
Under General Information, set the Name property to TOTAL_COMP.
Under Placeholder/Formula, click the PL/SQL Formula property field to display the PL/SQL Editor.
In the PL/SQL Editor, use the template to enter the following PL/SQL code:
function TOTAL_COMPFormula return Number is
begin
  return FINAL_CALC;
end;
|
Note: You can enter this code by copying and pasting it from the provided text file calledplsql_code.txt. This code is for the Total Comp Formula Column.
|
Click Compile.
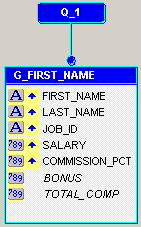
When the code is compiled without errors, click Close to display the data model for your report in the Data Model view. It should look something like this:
Figure 39-8 Data Model with BONUS and TOTAL_COMP formula columns
Save your report.
Now that you have created the necessary formula columns and functions, you can create the layout for your report.
To create the report layout:
Click the Paper Layout button in the toolbar to display the Paper Layout view.
In the Paper Layout view, choose Insert > Report Block.
In the Report Block Wizard, on the Style page, select Tabular, then click Next.
On the Groups page, click G_FIRST_NAME in the Available Groups list and click Down to specify the Print Direction and move this group to the Displayed Groups list, then click Next.
On the Fields page, click the double right arrows (>>) to move all of the fields to the Displayed Fields list. The Displayed Fields list should look like this:
|
Note: If the fields do not display in the correct order, simply click the field name and drag the field to the correct position in the list. |
Click Next.
On the Labels page, change the labels as follows, then click Next:
| Fields | Labels |
|---|---|
| COMMISSION_PCT | Commission
|
| TOTAL_COMP | Total Compensation
|
On the Template page, click Finish to display your report layout in the Paper Layout view. It should look something like this:
Figure 39-10 Paper Layout view of the PL/SQL example report

Click the Run Paper Layout button in the toolbar to run and display your report in the Paper Design view.
In the Paper Design view, click the Flex Off button in the toolbar.
Delete the Last Name label.
Change the text for the First Name label to Name.
Adjust the width of the new Name label to span over both the first name and last name columns.
Adjust the sizes of the first name and last name columns so that one character displays between the columns.
In the Object Navigator, double-click the properties icon next to the F_FIRST_NAME field to display the Property Inspector, and set the following properties:
Under General Layout, set the Vertical Elasticity property to Fixed, and set the Horizontal Elasticity property to Variable.
Repeat the above step for the F_LAST_NAME field.
Click the Paper Layout button in the toolbar to display the Paper Layout view.
In the Paper Layout view, click the Frame tool in the tool palette.
Draw a frame around the two fields: F_FIRST_NAME and F_LAST_NAME.
With the frame selected, choose Tools > Property Inspector to display the Property Inspector, and set the following properties:
Under General Information, set the Name property to M_NAME.
In the Paper Layout view, make sure Flex Off is selected in the toolbar.
With the frame selected, choose Layout > Move Backward until the frame encloses both the F_FIRST_NAME and F_LAST_NAME fields.
|
Tip: You can watch the fields in the Object Navigator as you choose Layout > Move Backward. When you see the two fields are sub-nodes of M_NAME, stop. |
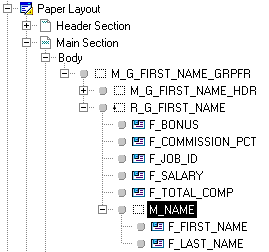
When you are done, the Object Navigator should look like this:
Figure 39-11 Object Navigator with M_NAME repeating frame
Click the Paper Design button in the toolbar to display the report in the Paper Design view.
In the Paper Design view, Shift-click the values under the following columns:
Salary
Commission
Bonus
Total Compensation
Click the Currency button in the toolbar to add "$" to the numbers.
Click the Add Decimal Place button twice to add two decimal points to the numbers.
Shift-click the Salary, Commission, Bonus, and Total Compensation column headings to select them too.
Click the Align Right button to right justify the columns.
Your report should now look something like this:
Figure 39-12 Paper Design view of modified report

Save your report.
To make the report more readable, you can add space between a certain number of records. To do so, you first create the parameter that determines the number of records between which the space will display. Then, you create a summary column in the data model that counts the number of records. You will then modify the paper layout of your report so that the vertical elasticity is variable. Finally, you will create a format trigger that will display the space between the user-determined number of records.
The parameter you will create in this section will determine how many records are displayed before an extra space is printed. Since this parameter is a user parameter, the user can change this value at runtime.
To create a user parameter:
In the Object Navigator, under the Data Model node, click the User Parameters node.
Choose Edit > Create to create a new user parameter under the User Parameters node.
If the Property Inspector is not already displayed, right-click the new user parameter (P_1), then choose Property Inspector to display the Property Inspector, and set the following properties:
Under General Information, set the Name property to SPACE.
Under Parameter, set the Datatype property to Number, and set the Initial Value property to 5.
|
Note: By giving the user parameter an initial value, the user can simply run the report without changing the parameters, and a space will display between every five records. |
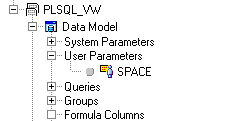
The user parameter now displays in the Object Navigator:
Figure 39-13 User Parameter in the Object Navigator
Save your report.
In this section, you will create a summary column in the data model that counts the number of employee records. This information will then be used by the format trigger to determine where to add extra space.
To create a summary column:
In the Object Navigator, double-click the view icon next to the Data Model node to display the Data Model view.
In the Data Model view, click the Summary Column tool in the tool palette, then click in the G_FIRST_NAME group beneath the TOTAL_COMP formula column to create a new summary column:
Figure 39-14 Data Model with new summary column
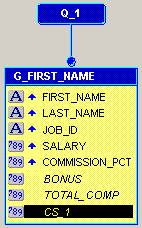
Double-click the new summary column object (CS_1) to display the Property Inspector, and set the following properties:
Under General Information, set the Name property to CNT_COLUMN.
Under Summary, set the Function property to Count, and set the Source property to FIRST_NAME.
Save your report.
To allow Reports Builder to insert the vertical spacing, you must modify the layout of your report.
To add vertical elasticity:
Click the Paper Layout button in the toolbar to display the Paper Layout view.
Click the Flex On button in the toolbar.
In the Paper Layout view, click the repeating frame associated with G_FIRST_NAME.
|
Note: If you cannot find the repeating frame in the Paper Layout view, you can click R_G_FIRST_NAME in the Object Navigator. The associated repeating frame will be selected in the Paper Layout view. |
Click the center handle of the frame and drag the frame downward to create additional space. This additional space should be slightly larger than what you want to see between the sets of records.
With the repeating frame selected, choose Tools > Property Inspector to display the Property Inspector, and set the following properties:
Under General Layout, set the Vertical Elasticity property to Variable.
In the Paper Layout view, click the Rectangle tool in the tool palette, and draw a rectangle below the fields in the newly created space.
Make sure the new rectangle has no fill and no line so that it is not visible.
The following image shows the new layout with the invisible rectangle:
Figure 39-15 Layout with added vertical space

Save your report.
Now that you have adjusted the layout, you can create a format trigger based on the new boilerplate rectangle you created in the previous section. This format trigger will display this space after every set number of records, determined by the user parameter.
To create a format trigger on the boilerplate rectangle:
While the rectangle is selected in the Paper Layout view, press F11 on your keyboard (or choose Tools > PL/SQL Editor) to display the PL/SQL Editor.
In the PL/SQL Editor, use the template to enter the following PL/SQL code:
function B_1FormatTrigger return boolean is
begin
 If :CNT_COLUMN mod :SPACE = 0 then
   return(TRUE);
 else
   return(FALSE);
 end if;
end;
|
Note: You can enter this code by copying and pasting it from the provided text file calledplsql_code.txt. This code is for the Format Trigger.
|
Click Compile.
When the code is compiled without errors, click Close.
Save your report.
Now that you have added space and created your format trigger, your report should display with space after every five records (or the number of records you specify in the Parameter Form).
To run your report:
Click the Run Paper Layout button in the toolbar. When the Parameter Form displays, click the Run button in the toolbar.
Your report displays in the Paper Design view, and should look something like this:
Congratulations! You have successfully built a report that uses an external PL/SQL library to calculate employee bonuses, which you can now use in other reports by simply referring to it. You now know how to:
create and use an external PL/SQL library.
create a default layout in the Report Wizard.
add vertical space between a user-determined number of records.
For more information on any of the wizards, views, or properties used in this example, refer to the Oracle Reports online Help, which is available in Reports Builder or hosted on the Oracle Technology Network (OTN), as described in Section 3.1.1, "Using the Oracle Reports online Help".