|
Oracle® Reports Building Reports
10g Release 2 (10.1.2) B13895-01 |
|
 Previous |
 Next |
|
Oracle® Reports Building Reports
10g Release 2 (10.1.2) B13895-01 |
|
 Previous |
 Next |
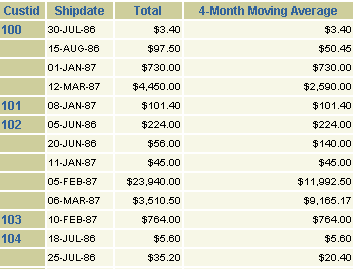
In this chapter, you will learn about reports that show data based on calculations over a period of time. By following the steps in this chapter, you can generate the report output shown in Figure 28-1.
Figure 28-1 Time series calculations report output

Concepts
Reports with time series calculations calculate values over a specified period of time. The techniques described for this report can be used to produce other formats of time series calculations, as well.
Data Relationships
This time series calculations report uses a query that will compute four-month moving averages of customer purchases. The SELECT statement will sum the current purchase (TOTAL) with purchases made by that customer in the previous four months, then average that sum through use of a self-join. For example, if the data queried is 30-JUL-00, Oracle Reports will average all purchases the customer made between 30 MAR-00 and 30-JUL-00.
Example Scenario
In this example, you will use the Report Wizard to create a simple time series calculations report for both paper and the Web that calculates and displays the four-month average of purchases for each customer. For the JSP-based Web report, you will modify the Web source to change labels and add format masks.
As you build this example report, you will:
Create a query and the layout using the Report Wizard to create a data model and layout for both the paper and Web reports.
Modify the Web source of your JSP report to generate the JSP-based Web report.
To see a sample time series calculations report, open the examples folder named timeseries, then open the Oracle Reports example called timeseries.rdf. For details on how to open it, see "Accessing the Example Reports" in the Preface.
To build the example in this chapter, you must have access to the Summit Sporting Goods (SUMMIT) schema. To download the SQL scripts that install the schema, see "Accessing the Data Sources" in the Preface.
The steps in this section will show you how to build a simple data model and report layout in the Report Wizard, which you can then use to generate either a JSP-based Web report or a paper report. In the next section, you will modify the JSP so that the appropriate information displays in your Web report.
When you are creating a single-query report, such as this one, you can use the Report Wizard to create the data model and layout simultaneously.
To create a data model and layout:
Launch Reports Builder (or, if already open, choose File > New > Report).
In the Welcome or New Report dialog box, select Use the Report Wizard, then click OK.
If the Welcome page displays, click Next.
On the Report Type page, select Create both Web and Paper Layout, then click Next.
On the Style page, type a Title for your report, select Group Left, then click Next.
On the Data Source page, click SQL Query, then click Next.
On the Data page, enter the following SELECT statement in the Data Source definition field:
SELECT O.CUSTID, O.SHIPDATE, O.TOTAL,
AVG(A.TOTAL) MAVG
FROM ORD O, ORD A
WHERE A.CUSTID = O.CUSTID
AND A.SHIPDATE BETWEEN O.SHIPDATE -123 AND O.SHIPDATE
GROUP BY O.CUSTID, O.SHIPDATE, O.TOTAL
|
Note: You can enter this query in any of the following ways:
|
Click Next.
|
Note: If you are not already connected to a database, you will be prompted to connect to the database when you click Query Builder or Next. Ensure that you connect to a database that has the appropriate schema for this example. Section 28.1, "Prerequisites for this example" describes the sample schema requirements for this example. |
On the Groups page, click CUSTID and click the right arrow (>) to move this field to the Group Fields list, then click Next.
On the Fields page, click the double right arrows (>>) to move all of the fields to the Displayed Fields list, then click Next.
On the Totals page, click Next.
On the Labels page, change the label for MAVG to 4-Month Moving Average, then click Next
On the Template page, select Predefined Template and click Beige, then click Finish to display your report output in the Paper Design view.
In the Paper Design view, double-click field F_MAVG to display the Property Inspector, and set the following properties:
Under Field, set the Format Mask property to LNNNGNN0D00.
Do the same for field F_TOTAL.
Select the first number value underneath the Total label. Notice that all of the values are immediately selected.Shift-click the first number value underneath the 4-Month Moving Average label.Click the Align Right button. All of the values are immediately right aligned.
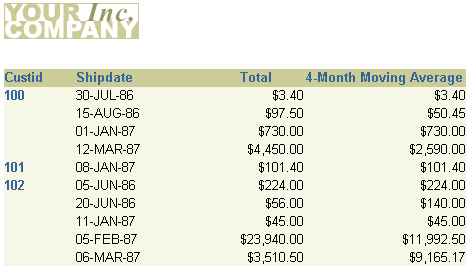
The report in the Paper Design view should now look something like this:
Figure 28-2 Paper Design view of the Time Series Calculations report

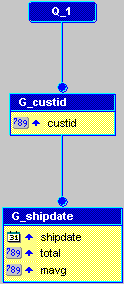
To view the data model you just created using the Report Wizard, click the Data Model button in the toolbar. The same data model can be used for both your paper and your JSP-based Web reports.
Your data model should look something like this:
Figure 28-3 Data Model view of the Time series Calculations report

Save your report as timeseries_your_initials.rdf.
Now that you have created your paper report layout, you can take the same report and generate a JSP-based Web report that looks the same as your paper report.
To modify your JSP-based Web report:
Save your report, timeseries_your_initials.rdf as a JSP under the same name (timeseries_your_initials.jsp).
Click the Web Source button in the toolbar to display the Web Source view.
In the Web Source, you need to change the format mask to match that of the paper report.
In the Web Source view, find the text:
<td <rw:headers id="HFtotal" src="HBtotal, HBcustid, HFcustid"/> class="OraCellNumber"><rw:field id="F_total" src="total" nullValue=" "> F_ total </rw:field></td>
Add the tag formatMask="LNNNGNN0D00" to the line, so that the line looks like this:
<td <rw:headers id="HFtotal" src="HBtotal, HBcustid, HFcustid"/>
class="OraCellNumber"><rw:field id="F_total" src="total"
formatMask="LNNNGNN0D00" nullValue=" "> F_total </rw:field></td>
|
Note: The bold text is the new format mask tag that we have added to the Total field. |
Change the format mask for the MAVG field. The resulting line in the Web Source should look like this:
<td <rw:headers id="HFmavg" src="HBmavg, HBcustid, HFcustid"/> class="OraCellNumber"><rw:field id="F_mavg" src="mavg" formatMask="LNNNGNN0D00" nullValue=" "> F_mavg </rw:field></td>
Save your report as a JSP.
Click the Run Web Layout button in the toolbar to display your new JSP-based Web report in your browser. The report should look something like this:
|
Notes:
|
Figure 28-4 Time Series Calculations JSP-based Web Report

The report displays the total for each customer, as well as the average over the past four months.
|
Note: For information on creating a Parameter Form for a JSP-based Web report, refer to the documented example on the Oracle Technology Network (OTN): on the Oracle Reports 10g page (http://www.oracle.com/technology/products/reports/index.html), click Getting Started to display the Getting Started with Oracle Reports home page. In the list of topic sections on the left, click Index. In the Collateral Type list, choose Examples, and click Search. In the list of examples that displays, click Building a JSP-based Web Report with a Parameter Form.
|
Congratulations! You have successfully created a time series calculations report for both paper and Web. You now know how to:
create a time series calculations report definition.
modify your report for the Web.
For more information on any of the wizards, views, or properties used in this example, refer to the Oracle Reports online Help, which is available in Reports Builder or hosted on the Oracle Technology Network (OTN), as described in Section 3.1.1, "Using the Oracle Reports online Help".