| Oracle® Enterprise Manager Concepts 10g Release 2 (10.2) Part Number B16241-01 |
|
|
View PDF |
| Oracle® Enterprise Manager Concepts 10g Release 2 (10.2) Part Number B16241-01 |
|
|
View PDF |
Enterprise environments consist of a wide variety of components: OS platforms, hardware, software, network, and storage devices. All of these components work in concert to deliver critical information and functionality required to keep enterprise operations performing optimally and providing information to make important business decisions. While Oracle Enterprise Manager Grid Control allows you to monitor and manage a variety of components out-of-box, you may want to monitor third party components or custom applications specific to your environment. For example, with this release, you can seamlessly monitor WebLogic and WebSphere application servers (refer to "Third-Party Target Management" in Chapter 15, "Host and Third-Party Target Management" for more information). Additional plug-ins are being developed and will be announced as they become available.
In addition, you can use the same mechanism used by Oracle and partners to extend Enterprise Manager to monitor custom components via modular Management Plug-ins. Once a plug-in is defined, you use the Enterprise Manager Grid Control console to deploy the new plug-in throughout your enterprise environment.
This chapter discusses the following topics:
Extending Enterprise Manager for monitoring additional components provides the following benefits:
Centralize management information in a single console: When deployed, components defined by the Management Plug-in automatically appear in the Grid Control console. Being able to monitor all targets in your environment provides a consolidated view of your entire enterprise, thus allowing you to monitor and manage all components from a central point.
Extend Enterprise Manager's monitoring and management features to non-Oracle components: Newly added components automatically inherit Enterprise Manager's powerful monitoring and management features, such as: alerts, policies, blackouts, monitoring templates, groups/systems, configuration management, and enterprise reporting.
Comprehensive Service-Level Management: By managing all of your enterprise components with Enterprise Manager Grid Control, you can more fully utilize the Service-Level Management features offered in Enterprise Manager Grid Control.
Management Plug-ins allow you to seamlessly monitor and manage non-Oracle components from the Grid Control console by providing an easy way to specify new classes of components for Enterprise Manager to monitor. Once you have created the new Management Plug-in, you then deploy it to Management Agents within your enterprise.
The complete lifecycle of extending Enterprise Manager consists of five stages:
Design your Management Plug-in.
Develop the plug-in.
Validate the plug-in.
Package the plug-in into a portable archive file.
Deploy the Management Plug-in throughout your Enterprise Manager environment.
In order to understand what it takes to develop a Management Plug-in, it is important to study the architecture of the Oracle Management Agent. Oracle Management Agents are deployed on each host, and are responsible for monitoring all components on that host. Out-of-box, the Management Agent knows how to monitor default target types, such as the Oracle Database. In order to monitor a particular target type, the agent uses two XML files:
Target Type Metadata File: specifies the metrics that should be monitored for this target type, and methods to retrieve those metrics.
Target Type Default Collections File: specifies the default collection intervals and alert thresholds for each of the target metrics.
For each metric, the Management Agent retrieves the appropriate data using fetchlets, which are parameterized data access mechanisms that take arguments for input and return formatted data. The following table lists available fetchlets.
Table 9-1 Fetchlets
| Fetchlet | Description |
|---|---|
|
OS Command |
Obtains metric data by executing OS commands (either individually or from scripts) that return a standard out data stream. |
|
SQL |
Executes a given SQL statement on an Oracle Database as a given user. |
|
JDBC |
Executes SQL against any JDBC-enabled database. |
|
SNMP (v.1) |
Polls an SNMP agent on a given host for corresponding instances given a list of object identifiers (OIDs). An object identifier (OID) corresponds to either a MIB variable instance or a MIB variable with multiple instances. |
|
HTTP Data |
Contacts a Web Server at a URL, and parses returned data. |
|
URLXML |
Obtains the XML content of a given URL, and extracts information based on a given pattern. |
|
WBEM |
Accesses a CIMOM and retrieves requested information using the specified CIM class. |
|
JMX |
Fetches data from a JMX-enabled server |
|
Java Wrapper |
Executes Java code to return data. |
|
SQL Timing |
Times a SQL operation. |
|
URL Timing |
Gets the contents of a given URL, timing not only the base page source but any frames or images in the page as well. |
The Agent uses the information in the Target Type Default Collections file to determine, for each target, the metrics that need to be collected and the corresponding collection frequency. It then uses information in the Target Type Metadata Files to determine how to collect the data. Based on this information, the Agent uses the appropriate fetchlet to retrieve data from the monitored targets.
The design stage of the management plug-in creation process involves defining the monitoring parameters required to accurately monitor and manage your new component. This involves:
Identifying performance and configuration metrics that should be collected.
Determining how often each metric should be collected. Oracle recommends that the collection frequency for any metric should not be less than once every five minutes.
Based on customer-specific operational practices, specifying default warning and/or critical thresholds on these metrics. Whenever a threshold is crossed, Enterprise Manager generates an alert, informing administrators of potential problems.
Developing a plug-in based on the requirements identified in the design phase involves:
For each metric, determining the appropriate component-level API that exposes the metric.
Mapping a method used to retrieve a particular metric to a 'Fetchlet' provided with the Agent, writing appropriate scripts to retrieve metrics, and determining input parameters for fetchlets. For example, the OS fetchlet will require an OS script, and a URL Timing fetchlet will require a URL parameter.
Defining two XML files (Target Type definition file and Default Collections file) that the agent will use to monitor the new target type. This involves declaring appropriate metrics, metric collection methods, collection frequencies, and metric thresholds in the specified XML format.
The example below is an excerpt from a target type Metadata file showing a sample metric declaration for collecting CPU Utilization. The OS Command fetchlet is used to retrieve the metric value by running an existing Perl script.
Example 9-1 Target Type Metadata File Excerpt
<Metric NAME="Load" TYPE="TABLE">
   <TableDescriptor>
       <ColumnDescriptor NAME="CPU Utilization" TYPE="NUMBER"/>
   </TableDescriptor>
   <QueryDescriptor FETCHLET_ID="OS">
<Property NAME="scriptsDir" SCOPE="SYSTEMGLOBAL"> scriptsDir     </Property>
<Property NAME="script" SCOPE="GLOBAL"> %scriptsDir% /cpu_util.pl </Property>
</QueryDescriptor>
</Metric>
Once a metric has been defined in the Target Type Metadata file, the next step is to define metric collection frequency and appropriate metric thresholds. The following example includes a sample collections file for the MyDatabase target type, where CPU Utilization is collected every 10 minutes, and a critical alert should be generated when the metric value is greater than ("GT") ninety percent.
Successful integration of new target types with the Enterprise Manager framework relies on accurate XML. It is essential that the Target Type Metadata file and Default Collections file are syntactically and structurally correct. It is also critical to simulate a runtime data collection for a new target type to ensure that proper data is collected, as well as ensuring that there are no adverse performance effects. To facilitate the validation process, Enterprise Manager provides a tool call ILINT.
You package all of the files associated with a Management Plug-in (metadata files, monitoring scripts, report files) into a Management Plug-in Archive (MPA) via EM CLI. The MPA is a ".jar" file that contains one or more Management Plug-ins, thus facilitating easy import/export of plug-ins.
To run the EMCLI, open a terminal window on any machine where the EMCLI client is installed and execute the add_mp_to_mpa verb. The following example demonstrates verb usage:
Example 9-3 Using the EMCLI to create a Management Plug-in Archive
emcli add_mp_to_mpa
       -mpa="/my_dir/my_new_type.jar"
       -mp_version="2.0"
       -ttd="/my_dir/ttd/new_type.xml"
       -dc="/my_dir/dc/new_type.xml"
       -file="MONITORING_SCRIPT:/my_dir/script1.pl"
       -file="MONITORING_SCRIPT:/my_dir/script2.pl"
       -func_desc="Management Plug-in to define target type new_type"
After you have added one or more Management Plug-ins to the archive file, you are ready to deploy your plug-in to Management Agents in your enterprise.
After a Management Plug-in Archive file is created, Enterprise Manager makes it simple to deploy the new Management Plug-in. The deploy operation is performed directly from the Grid Control console and consists of three steps:
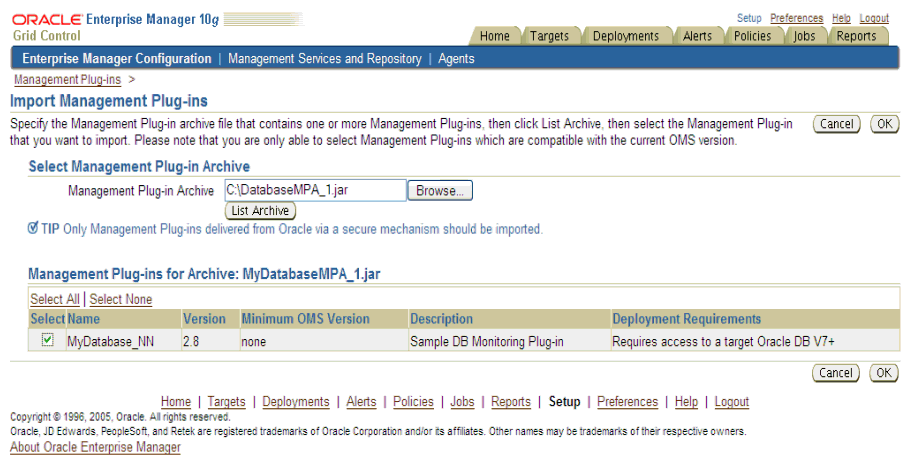
Import the Management Plug-ins into the Grid Control console.
Figure 9-1 Management Plug-in Import Page

Once imported, the plug-ins appear on the Management Plug-ins page, and can be deployed to any number of Management Agents simultaneously.
Deploy the Management Plug-in(s) to the appropriate Agents.
Management Plug-ins can be deployed simultaneously to any number of Agents without causing any downtime to production environments. Enterprise Manager automatically copies appropriate metadata files and monitoring scripts to the selected Agents.
Figure 9-3 Deploy Management Plug-in Page

Once the Management Plug-in is deployed, Management Agents can monitor targets of the new type.
Discover the Management Plug-ins at the Agent.
Once a Management Plug-in is deployed, the Agent knows how to monitor the new target type. At this point, all that remains is to instruct the Agent to start monitoring one or more instances of the new target type. This involves discovering targets from the Agent home page by specifying a small set of target properties, such as SID and Username for a database.
Each Enterprise Manager managed target has a default home page that provides a consolidated, at-a-glance view of its health and performance status. The home pages also provide direct access to configuration information and management/monitoring features such as Blackouts, Monitoring Configuration, and Alert History. This rich user interface is available to Management Plug-Ins out-of-box, without any custom code.
Enterprise Manager provides a powerful reporting framework called Information Publisher, which allows you to:
Create custom reports against the Management Repository via the Grid Control console or by using the Information Publisher PL/SQL API.
Generate reports on a schedule and share them with the entire user community.
Create out-of-box monitoring, configuration, and service-level reports.
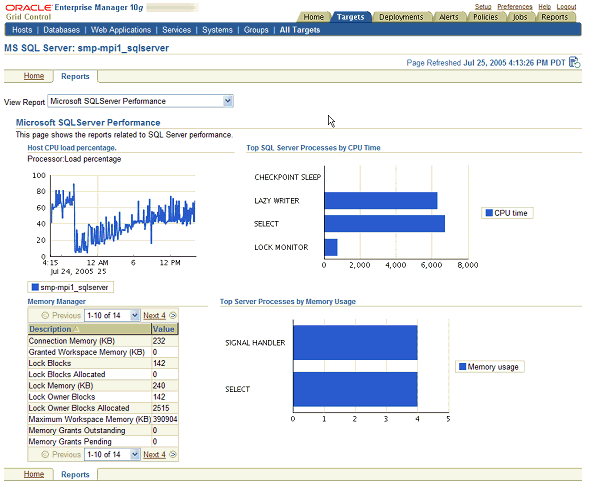
When developing a Management Plug-in, you can enhance information available from a default target home page by developing a management report definition using the Information Publisher PL/SQL API. These report definitions can be packaged with the plug-in, and are available from the Reports tab on the default target home page.
Figure 9-5 Default Target Home Page with Real-Time Report
