"Wind Rose"...
"Wind Rose"...
"Wind Rose"...
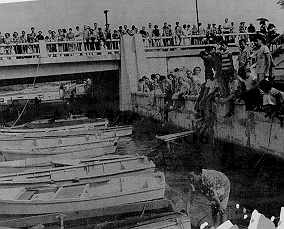
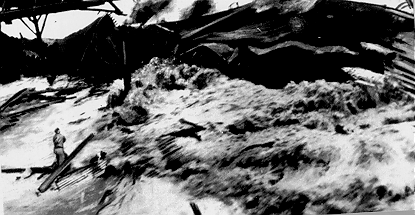
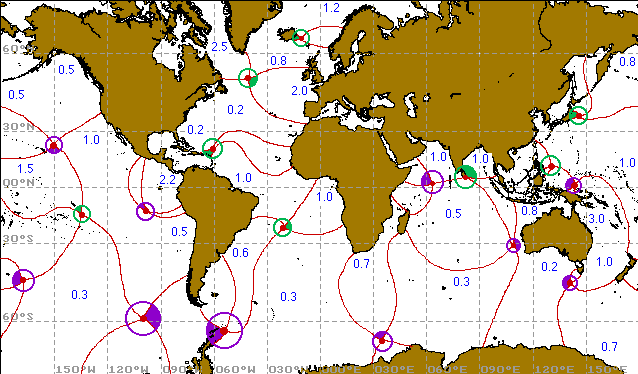
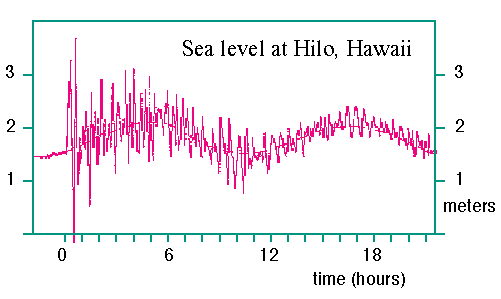 shows a record of a tsunami from an Alaskan earthquake recorded in Hawaii. Tsunamis were used to estimate the depth of the
ocean in 1856, when direct depth measurements were virtually impossible, by observing their phase speed. The result for the
North Pacific was 4,200 - 4,500 m, which was a considerable improvement on the previous estimate of 18,000 m.
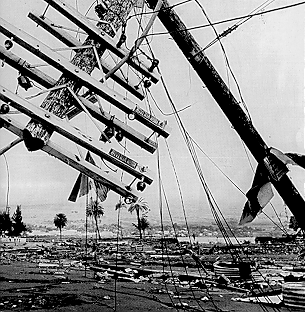
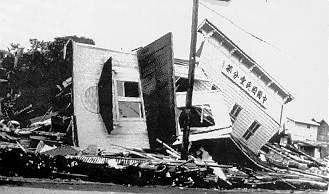
gives an example of a sea level record showing the passage of a tsunami in Hawaii. You can also view some photos showing
the impact of a major tsunami.
shows a record of a tsunami from an Alaskan earthquake recorded in Hawaii. Tsunamis were used to estimate the depth of the
ocean in 1856, when direct depth measurements were virtually impossible, by observing their phase speed. The result for the
North Pacific was 4,200 - 4,500 m, which was a considerable improvement on the previous estimate of 18,000 m.
gives an example of a sea level record showing the passage of a tsunami in Hawaii. You can also view some photos showing
the impact of a major tsunami.

 |
 |
 |

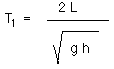
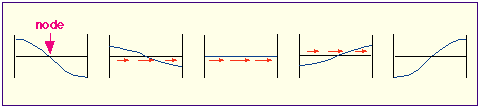 shows the first order seiche (of period T1),
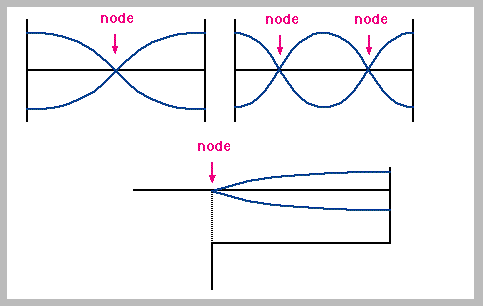 the second order seiche (of period T2 = 1/2 T1).
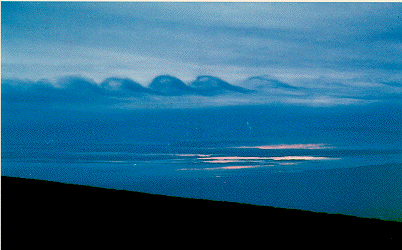
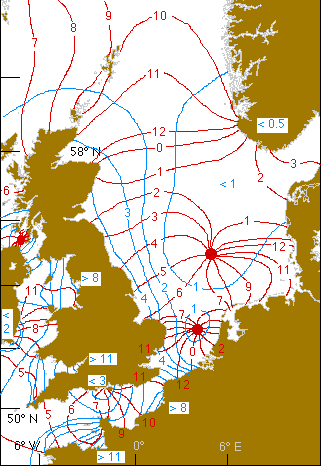
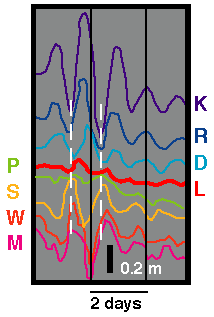 shows a first order seiche in the Baltic Sea, where such oscillations of water level are usually produced by storms systems
travelling across. The storm triggers a free oscillation (seiche) which then continues for several days before it is damped
by bottom friction.
shows a first order seiche in the Baltic Sea, where such oscillations of water level are usually produced by storms systems
travelling across. The storm triggers a free oscillation (seiche) which then continues for several days before it is damped
by bottom friction.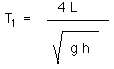
 and
and
 show two examples.
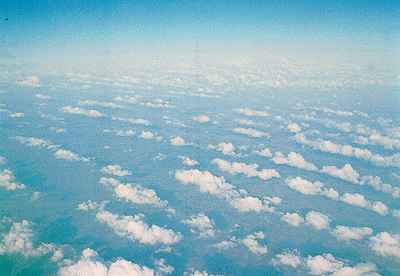
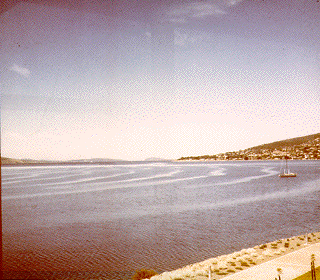
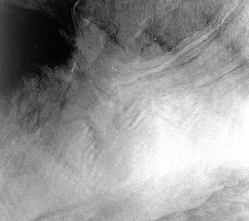
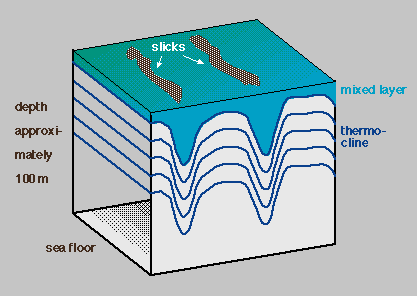 shows an example of an internal wave travelling on the seasonal thermocline in coastal waters. Such waves typically have
wave lengths of several tens of metres and periods of about 30 minutes. Convergence of surface particle movement above the
wave troughs near the surface often collects floating matter and makes the waves visible as slick marks (
shows an example of an internal wave travelling on the seasonal thermocline in coastal waters. Such waves typically have
wave lengths of several tens of metres and periods of about 30 minutes. Convergence of surface particle movement above the
wave troughs near the surface often collects floating matter and makes the waves visible as slick marks (
 ). If the interface on which the wave travels is very shallow, ships may find themselves in a situation that most of the
energy put into the propeller goes into driving the circular particle motion of the internal wave at the interface, with
the ship making little or no progress through the water. This phenomenon is known as "dead water" and is common in fjords,
where the interface is produced by a shallow layer of freshwater from glacier runoff overlying oceanic water underneath.
The most common internal waves are of tidal period and manifest themselves in a periodic lifting and sinking of the seasonal
and permanent thermocline at tidal rythm. In some ocean regions their surface expressions, produced by convergence over the
wave troughs, is visible in satellite images (
). If the interface on which the wave travels is very shallow, ships may find themselves in a situation that most of the
energy put into the propeller goes into driving the circular particle motion of the internal wave at the interface, with
the ship making little or no progress through the water. This phenomenon is known as "dead water" and is common in fjords,
where the interface is produced by a shallow layer of freshwater from glacier runoff overlying oceanic water underneath.
The most common internal waves are of tidal period and manifest themselves in a periodic lifting and sinking of the seasonal
and permanent thermocline at tidal rythm. In some ocean regions their surface expressions, produced by convergence over the
wave troughs, is visible in satellite images (
 ).
).
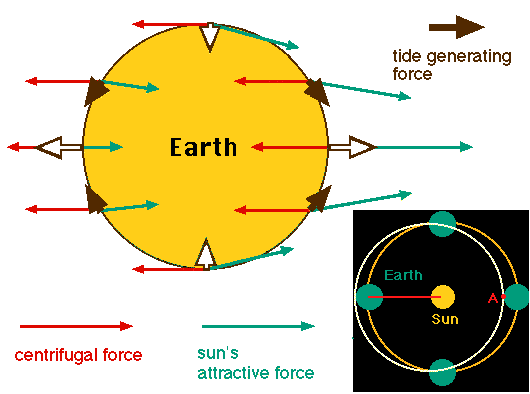 ). It follows that the tide generating force varies in intensity and direction over the earth's surface. Its vertical
component is negligibly small against gravity; its effect on the ocean can be disregarded. Its horizontal component
produces the tidal currents, which result in sea level variations (
). It follows that the tide generating force varies in intensity and direction over the earth's surface. Its vertical
component is negligibly small against gravity; its effect on the ocean can be disregarded. Its horizontal component
produces the tidal currents, which result in sea level variations (
 ). The tide-generating force is proportional to the mass of the celestial body but inversely proportional to the square of
the distance. The larger distance between the sun and earth, compared to the distance between the moon and earth, means that
the tide-generating force from the sun is only about 46% of that from the moon. Other celestial bodies do not exert a measurable
tidal force.
). The tide-generating force is proportional to the mass of the celestial body but inversely proportional to the square of
the distance. The larger distance between the sun and earth, compared to the distance between the moon and earth, means that
the tide-generating force from the sun is only about 46% of that from the moon. Other celestial bodies do not exert a measurable
tidal force.
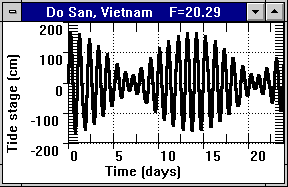
| Value of F | Category |
| 0 - 0.25 | Semidiurnal |
| 0.25 - 1.5 | Mixed, mainly semidiurnal |
| 1.5 - 3 | mixed, mainly diurnal |
| > 3 | Diurnal |
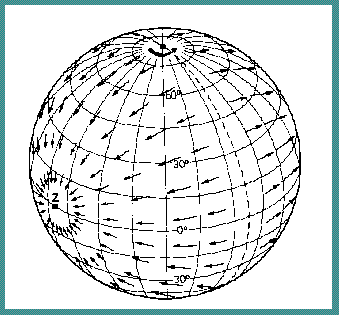
 shows examples.
 shows examples.
). Their results have to be verified against observations of tidal range and times of occurrence of high and low water.
Distortions of the wave on the continental shelf caused by shallow water make it difficult to assess results for the open
ocean. In deep water the tidal range rarely exceeds 0.5 m.
shows examples.
). Their results have to be verified against observations of tidal range and times of occurrence of high and low water.
Distortions of the wave on the continental shelf caused by shallow water make it difficult to assess results for the open
ocean. In deep water the tidal range rarely exceeds 0.5 m.
 shows examples.
shows an example of a co-oscillation tide in a large bay. The tide is forced from the open end by the oceanic tide, which
has an maximum tidal range (at spring tide) of about 1 m. Because of the width of the basin the Coriolis force is able to
shape the wave, producing amphidromic points around which the wave propagates. Amplification is particularly large along
the British coast and in the English Channel.
shows examples.
shows an example of a co-oscillation tide in a large bay. The tide is forced from the open end by the oceanic tide, which
has an maximum tidal range (at spring tide) of about 1 m. Because of the width of the basin the Coriolis force is able to
shape the wave, producing amphidromic points around which the wave propagates. Amplification is particularly large along
the British coast and in the English Channel.
 shows examples.
). Examples of large salt wedge estuaries are the Mississippi and the Congo Rivers. Other examples may be as small as only
a few kilometres long. Note the vertical exaggeration in this and the following figures.
shows examples.
). Examples of large salt wedge estuaries are the Mississippi and the Congo Rivers. Other examples may be as small as only
a few kilometres long. Note the vertical exaggeration in this and the following figures.
 shows examples.
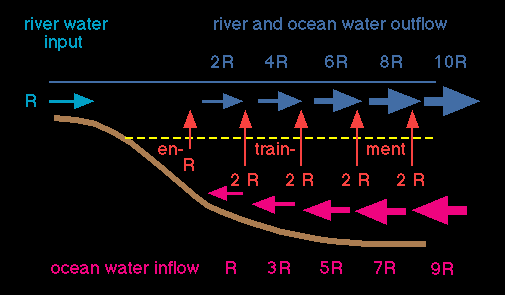
). Examples of this type of estuary are fjords, which are usually very deep and have a large salt water reservoir below
the upper layer. Moderately deep river beds often exhibit this type of stratification during periods of weak river flow.
The upward mass flux of salt water leads to an increase of flow speed in the upper layer. This increase of mass transport
in the upper layer can be quite significant, to the extent that the river output appears insignificant compared with the
overall circulation (
shows examples.
). Examples of this type of estuary are fjords, which are usually very deep and have a large salt water reservoir below
the upper layer. Moderately deep river beds often exhibit this type of stratification during periods of weak river flow.
The upward mass flux of salt water leads to an increase of flow speed in the upper layer. This increase of mass transport
in the upper layer can be quite significant, to the extent that the river output appears insignificant compared with the
overall circulation (
 shows examples.
). A 20-fold amplification of the mass transport into the sea
is quite realistic. The surface velocity increases likewise, although not as dramatically, as the downstream increase in
width of the estuary compensates for some of the increase in mass transport.
shows examples.
). A 20-fold amplification of the mass transport into the sea
is quite realistic. The surface velocity increases likewise, although not as dramatically, as the downstream increase in
width of the estuary compensates for some of the increase in mass transport.
 shows examples.
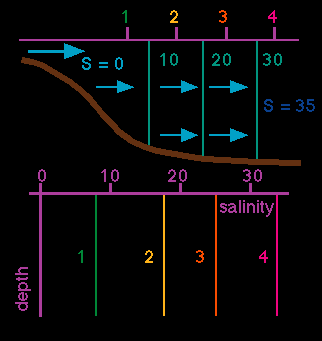
). There is some increase in surface velocity and upper layer transport towards the sea
but not nearly as dramatic as in the highly stratified case. This type of estuary is widespread in temperate and subtropical
climates; many examples are found around the world.
shows examples.
). There is some increase in surface velocity and upper layer transport towards the sea
but not nearly as dramatic as in the highly stratified case. This type of estuary is widespread in temperate and subtropical
climates; many examples are found around the world.
 shows examples.
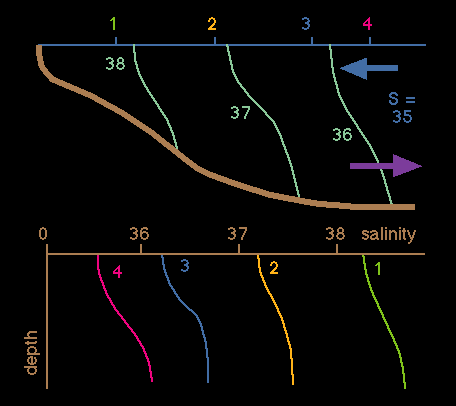
). This type of estuary is found in regions of particularly strong tides; an example is the River Severn in England.
shows examples.
). This type of estuary is found in regions of particularly strong tides; an example is the River Severn in England.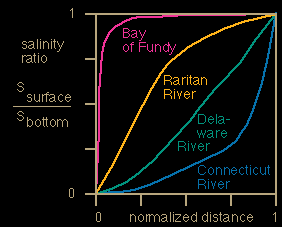 shows examples.
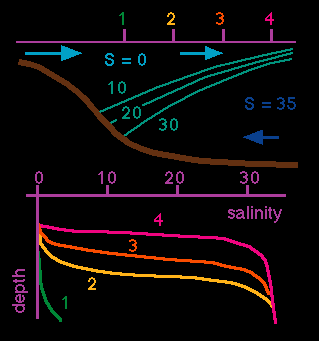
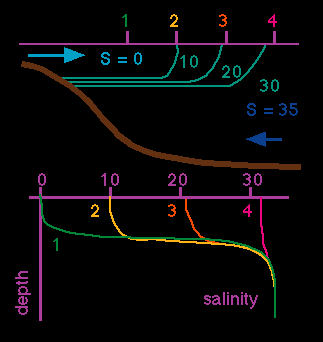
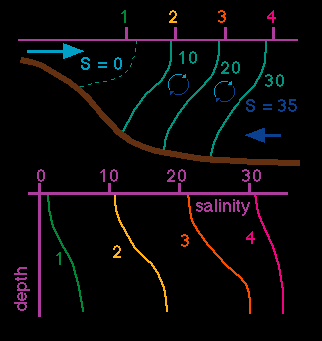
shows the unified classification scheme based on salinity. The salt wedge estuary has freshwater at the surface, oceanic
water at the bottom and is thus identified by a salinity ratio of zero. It occupies the bottom line of the diagram. Salinity
in the vertically mixed estuary varies along the estuary but is the same at the surface and at the bottom everywhere, so the
vertically mixed estuary has a salinity ratio of one and occupies the top line of the diagram. The highly stratified estuary
is found in the lower left triangle, the slightly stratified estuary in the upper right triangle. Estuaries can change type
as a result of variations in rainfall and associated river flow. They may show different characteristics in different parts
as a result of topographic restrictions on the propagation of the tide along the estuary which affect the tidal volume. The
classification diagram can be used to establish changes of estuary type in space and time.
shows examples.
shows the unified classification scheme based on salinity. The salt wedge estuary has freshwater at the surface, oceanic
water at the bottom and is thus identified by a salinity ratio of zero. It occupies the bottom line of the diagram. Salinity
in the vertically mixed estuary varies along the estuary but is the same at the surface and at the bottom everywhere, so the
vertically mixed estuary has a salinity ratio of one and occupies the top line of the diagram. The highly stratified estuary
is found in the lower left triangle, the slightly stratified estuary in the upper right triangle. Estuaries can change type
as a result of variations in rainfall and associated river flow. They may show different characteristics in different parts
as a result of topographic restrictions on the propagation of the tide along the estuary which affect the tidal volume. The
classification diagram can be used to establish changes of estuary type in space and time.
 shows examples.
). This results in a density increase and sinking of high salinity water at the inner end. As a result, movement of water
is directed inward at the surface and towards the sea at the bottom, with sinking at the inward end. Compared to the
estuaries discussed above their circulation is reversed, which explains the name inverse estuary. Some tropical Australian
estuaries show a combination of 'normal' and 'inverse' circulation.
shows examples.
). This results in a density increase and sinking of high salinity water at the inner end. As a result, movement of water
is directed inward at the surface and towards the sea at the bottom, with sinking at the inward end. Compared to the
estuaries discussed above their circulation is reversed, which explains the name inverse estuary. Some tropical Australian
estuaries show a combination of 'normal' and 'inverse' circulation.
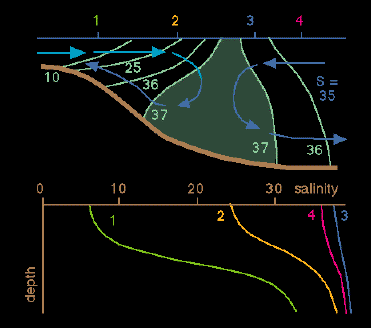 shows examples.
shows the example of the Alligator River. The estuary receives some fresh water from river inflow but evaporation is so
strong that at some intermediate position all river water has evaporated and salinity becomes higher than in the open sea.
Upstream from this position the circulation is "normal"; downstream it is "inverse". Other examples are the Escape River
and the Wenlock and Duncie Rivers.
, but the effect of their high environmental variability on marine life is so overwhelming that a separate classification
appears justified. Marine life in intermittent estuaries undergoes a complete change of communities between the estuarine
and oceanic phases - very few plants or animals can cope with the salinity changes that occur between the two phases.
shows examples.
shows the example of the Alligator River. The estuary receives some fresh water from river inflow but evaporation is so
strong that at some intermediate position all river water has evaporated and salinity becomes higher than in the open sea.
Upstream from this position the circulation is "normal"; downstream it is "inverse". Other examples are the Escape River
and the Wenlock and Duncie Rivers.
, but the effect of their high environmental variability on marine life is so overwhelming that a separate classification
appears justified. Marine life in intermittent estuaries undergoes a complete change of communities between the estuarine
and oceanic phases - very few plants or animals can cope with the salinity changes that occur between the two phases.