Design of Pumping Stations - 4...


Nomenclature...

Symbol Definition Units
h S Static lift, resistance at zero flow m
h PIPE Pumping head losses owing to pipe friction m
Q Liquid flow rate m 3 / h
n Manning coefficient Dimensionless
d Pipe diameter ( internal ) mm or m
l Pipe length m or km
h FTG Pumping head losses due to bends, valves, etc. m
C Friction loss coefficient Dimensionless
V Velocity of flow in pipe m / s
g Gravitational constant m / s 2
H Total pumping head ( = h S + h PIPE + h FTG ) m
P Pump input power kW
Q GAS Gas flow rate to air lift pump m 3 free air / s
C ' Constant m 3 / s
m Constant Dimensionless
s Depth of submergence m
L Lift height ( air input to top of rising main ) m

1. Pump Requirement...

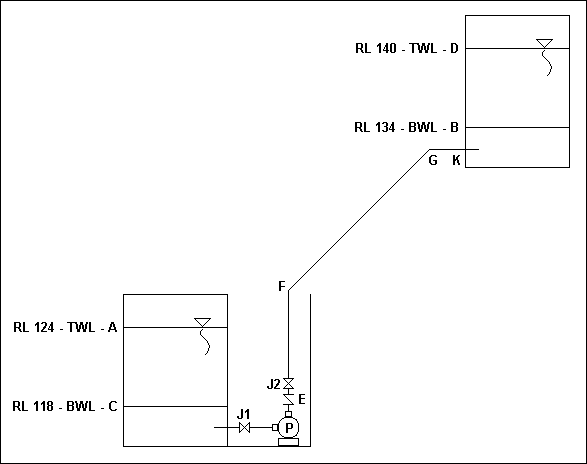
One relatively straightforward method of choosing a pump for a job is to consider a simple pumping network ; to calculate the head losses and hence to determine the duty range on the pump characteristic curve. Considering the pumping system in figure given below, the pump has to overcome both static lift ( h S ), i.e. initally from A ( TWL in the sump ) to B ( BWL in the reservoir ) or just prior to when pumping ceases, from C ( BWL in sump ) to D ( TWL in the reservoir ), and also the frictional resistance caused by the moving liquid.


This latter term can be expressed as a head loss ( m ) thus ;

h PIPE = ( 7,952 x 10 9 ) ( l ) { [ ( Q ) ( n ) ] / ( d 8 / 3 ) } 2

h PIPE in m, l in km, Q in m 3 / h, d in mm and Manning coefficient is dimensionless ( 0.011 to 0.013 for iron pipes, see table given below ).

Pipe material Condition Value of n
Coated iron and steel pipes New 0.010
Uncoated iron pipes New 0.011
Galvanized iron pipes New 0.012
Vitrified clay pipes After some weeks of service 0.012
Iron and steel pipes After use 0.013
All pipes With imperfect joints and in bad condition 0.015

Where a pipe has bends, T junction, etc., a further series of losses occur which are evaluated in the form ;

h FITTINGS = ( C ) ( V 2 ) / ( 2 g )

where ; C : coefficient which can be estimated from tables of the type shown in table given below.

Fitting C
Belmouth 0.10
Bend 0.25 to 0.50
T - junction 1.00
Sluice valve 0.15
Reflux valve ( single flap ) 0.70 to 2.00 *
( * : The value of C for reflux valves increases as the velocity decreases. )

Example - 01 :

Water is to be pumped by a rotodynamic ( centrifugal ) pump at a rate of 100 m 3 / h from the sump in figure given above to the reservoir. Assume bends at F, and G ( C = 0.30 ), a reflux valve at E ( C = 1.00 ), two fully open sluice valves J1 and J2 ( C = 0.15 ) and a leaving loss ( C = 1.00 ) at K. Calculate the head losses and find the extreme duty points on the pump characteristic curve ( usually supplied by the pump manufacturers ). Assume a rising main diameter of 150 mm and a Manning coefficient of 0.012 with pipe length of 250 m.

Calculation :

- Minimum static lift = 134.0 - 124.0 = 10.0 m
- Maximum static lift = 140.0 - 118.0 = 22.0 m

At 25 m 3 / h, friction head losses in the pipe can be calculated as ;

h PIPE = ( 7,952 x 10 9 ) ( 0.25 ) { [ ( 25 ) ( 0.012 ) ] / ( 150 8 / 3 ) } 2 = 0.4 m

Table given below shows similar values for other flow rates.

( 1 ) ( 2 ) ( 3 ) ( 4 )
Q ( m 3 / h ) h PIPE ( m ) h S - MIN ( m ) h S - MAX ( m )
0 0 10.0 22.0
25 0.4 10.4 22.4
50 1.7 11.7 23.7
75 3.9 13.9 25.9
100 6.9 16.9 28.9
125 10.7 20.7 30.7
150 15.4 25.4 37.4

In order to assess the friction loss due to fittings, the velocity must first be calculated from ;

V = [ ( 4 x 10 6 ) ( Q ) ] / [ ( 3,600 ) ( 3.14 ) ( d 2 ) ]

i.e. at 25 m 3 / h ;

V = 0.39 m / s

Therefore the head loss due to fittings is ;

h FTG = ( V 2 / 2 g ) ( C 1 + C 2 + C 3 + C 4 ...... )

h FTG = ( 0.39 2 / 2 x 9.81 ) [ ( 2 x 0.30 ) + 1.00 + ( 2 x 0.15 ) + 1.00 ] = 0.02 m

At other flow rates the head losses due to fittings are shown in table given below together with the total head loss for the system H = h S + h FTG + h PIPE .

( 1 ) ( 2 ) ( 3 ) ( 4 ) ( 5 )
Q ( m 3 / h ) V ( m / s ) h FTG ( m ) H MIN ( m ) H MAX ( m )
0 0 0 10.0 22.0
25 0.39 0.02 10.4 22.4
50 0.79 0.09 11.8 23.8
75 1.18 0.21 14.1 26.1
100 1.57 0.36 17.3 29.3
125 1.96 0.57 21.3 33.3
150 2.36 0.82 26.2 38.2

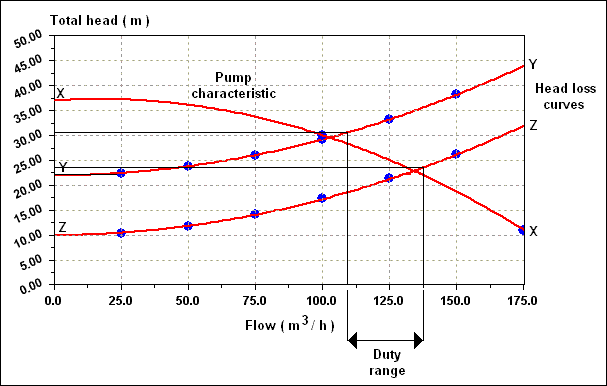
An imaginary pump characteristic curve for a rotodynamic pump is given as curve X - X in figure shown below. The pump would be chosen from a manufacturers catalogue after specifying the maximum pumping head and maximum flow. The curve in figure given below actually represents one size of impeller. In practice the impeller can be machined down to give better match between a particular pump and the system requirements.


The system resistance versus flow curves Y - Y and Z - Z have been superimposed on the pump characteristic curve in figure given above. Perpendiculars dropped from the minimum and maximum duty points onto the abcissa give the expected minimum and maximum flow rates.

2. Pump Input Power...

Efficiency contours have been superimposed on the pump characteristic curve in figure shown above. These can be used to give the required input power to the pump if this is not supplied by the pump manufacturers. If Q is raised H ( m ) against gravity at an efficiency ( E ) then the power ( P ) expended as ;

P = [ ( Q ) ( H ) ( g ) ] / ( E )

the units of P are 10 3 J / s, i.e. kW.

Example - 02 :

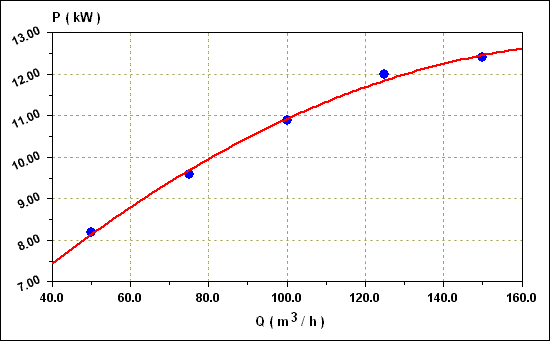
From the characteristic curve in figure shown above, construct a table of pump input power requirements for given flow rates, efficiencies and pumping head.

Calculation :

From the characteristic curve, a flow rate of 50 m 3 / h ( 0.014 m 3 / s ) can be achieved at 34.5 m head at an efficiency of, say, 0.58ç The power input necessary is therefore ;

P = [ ( 0.014 ) ( 34.5 ) ( 9.81 ) ] / ( 0.58 ) = 8.2 kW

The result of similar calculations are given in table shown below and plotted in figure given below.

Q ( m 3 / h ) Q ( m 3 / s ) H ( m ) E P ( kW )
50 0.014 34.5 0.58 8.2
75 0.021 33.0 0.71 9.6
100 0.028 30.5 0.77 10.9
125 0.035 26.5 0.76 12.0
150 0.042 20.5 0.68 12.4

3. Pumping of Viscous Sludges...

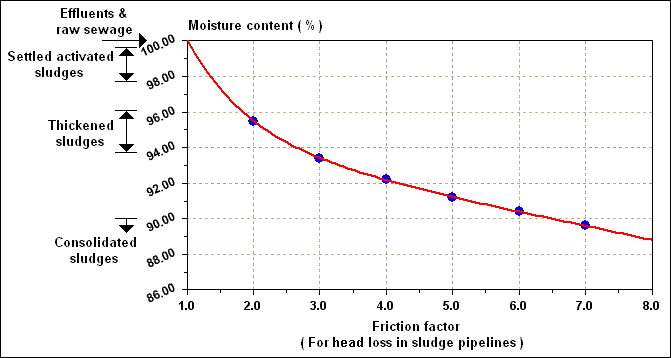
Water and dilute suspensions ( < 99.5 % MC ) are Newtonian fluids, i.e. a plot of shear stress versus shear rate gives a straight line through the origin whose slope is the single value of the absolute viscosity. Unfortunately, sludges do not follow this relationship and often show a decreasing apparent viscosity with increasing shear rate. Furthermore, the sludge changes its characteristics with changes in moisture content. Bartlett's suggested relationship of friction factor with moisture content ( MC ) is shown in figure given below. This curve can be used to calculate the head losses when pumping sludges.


Example - 03 :

Using the same conditions as in Example - 01 with the exception that a sludge of MC 94 % has to be pumped, calculate the head losses in the system. No change occurs in the static lifts which remain at 10.0 m ( minimum ) and 22.0 m ( maximum ). However, both the pipe friction losses and the fittings friction losses have to be multiplied by the factor 2.7 ( as figure given just above ).

Calculation :

The new minimum head loss at 100 m 3 / h flow is now H = 10.0 + ( 2.7 ) ( 7.3 ) = 29.7 m. Similar calculations for different flows are summarized in table given below.

Q ( m 3 / h ) H TOTAL - MINIMUM ( m ) H TOTAL - MAXIMUM ( m )
0 10.0 22.0
25 11.1 23.1
50 14.9 26.9
75 21.1 33.1
100 29.7 41.7
125 40.5 52.5
150 53.7 65.7

The pump shown in figure 3 is inadequate and a more powerful pump must be chosen.

4. Air Lift Pumps...

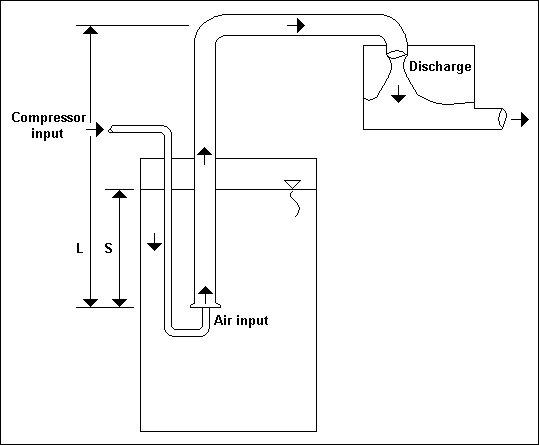
These are commonly found on small scale extended aeration plants as a means of returning settled activated sludge to the aeration tank. Larger capacity pumps are sometimes used for difficult situations where the low efficiency is offset by the lack of moving parts. Many parameters influence the performance characteristics but an approximate relationship between liquid pumping rate Q ( m 3 / s ) and volumetric rate of free gas input Q GAS ( m 3 / s ) in the region of maximum efficiency is of the type ;

Q = ( m ) [ log 10 ( Q GAS ) ] + C '

where ; C ' and m : constants which vary with rising main diameter and with ratios of S / L where S is the depth from air input to TWL and L is the length from air input to top of riser as shown in figure given below ;


Values of m and C ' are given for different pipe sizes and S / L ratios in table shown below. It should be noted that these data were obtained from a pump of length L = 4.25 m, and therefore should not be applied to pump lengths much less than 3.5 m or much greater than 5.0 m.

S / L ratio Pipe diameter ( mm ) m C '
0.71 25.4 0.0003 0.0013
38.1 0.0015 0.0050
50.8 0.0029 0.0087
0.53 25.4 0.0002 0.0010
38.1 0.0010 0.0033
50.8 0.0019 0.0053

Example - 04 :

Calculate the air requirement for an air lift system pumping 0.7 L / s water in a 50.8 mm pipe. The vertical rising main is 3.3 m tall and the submergence is 2.34 m, i.e. S / L is 0.71.

Calculation :

For this situation m is 0.0029 and C ' is 0.0087. Therefore ;

( 0.7 x 10 - 3 - 0.0087 ) / ( 0.0029 ) = log 10 ( Q GAS )

Therefore ;

Q GAS = 1.7 x 10 - 3 m 3 / s = 1.7 L free air / s