Release 9.0.1
Part Number A88748-02
Home |
Book List |
Contents |
Index |
 Master Index |
 Feedback |
| Oracle Enterprise Manager Getting Started with the Oracle Diagnostics Pack Release 9.0.1 Part Number A88748-02 |
|
Oracle Trace Data Viewer (hereafter referred to as Data Viewer) is an Oracle Enterprise Manager application that allows you to view formatted data collected by the Oracle Trace command line interface. For more information about using the command line interface to collect data, see the Oracle9i Database Performance Guide and Reference.
This chapter includes the following:
An Oracle Trace server collection typically contains a large volume of valuable information that can be used for troubleshooting and investigating SQL or wait activity and resource utilization. Data Viewer handles the complex task of extracting data and aggregating key server performance metrics on a large Oracle Trace collection. Once you select an Oracle Trace collection, you can have Data Viewer compute SQL or Wait statistics or both.
Once you select an Oracle Trace collection, Data Viewer runs through all of the Oracle Trace formatter tables, extracting, processing, and aggregating key performance metrics. This processed data is presented in a comprehensive set of Oracle Trace predefined data views.
A data view is the definition of a query into the formatted data collected by Oracle Trace. A data view consists of items or statistics to be returned and, optionally, a sort order and limit of rows to be returned.
With the data views provided by Data Viewer, you can:
If you want to define your own data views, you can use the Oracle Trace Data View Wizard.
Using Data Viewer you can:
Data Viewer provides predefined data views that can accelerate the process of identifying poorly performing SQL statements. Oracle Server SQL data views are grouped by categories. Some specific data views include:
Average Elapsed Time (sorts SQL by greatest average elapsed time per execution of queries within the collection)
Sorts in memory and sorts on disk and number of rows sorted
Disk Reads/Logical Reads Ratio (sorts SQL by worst disk to logical I/O data buffer cache hit rate)
You can access Data Viewer in the following ways:
The following sections explain how to use these methods.
To start Data Viewer from Oracle Enterprise Manager, either click on Trace Data Viewer from the Diagnostics Pack drawer or select Tools=>Diagnostics Pack=>Trace Data Viewer. The Oracle Trace Data Viewer Login box appears. Provide login information to connect to a schema containing formatted collections. Data Viewer displays all collections formatted to the schema (see Figure 7-1).
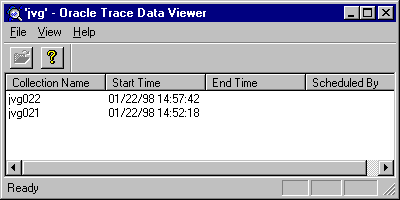
Decide which formatted collection you want to investigate and double-click on the collection name. The Work in Progress dialog box appears.
To start Data Viewer from the Start menu, select Start=>Programs=>ORACLE_HOME=>Diagnostics Pack=>Trace Data Viewer.
The Oracle Trace Data Viewer Login box appears. Provide login information to connect to a schema containing formatted collections. Data Viewer displays all collections formatted to the schema (see Figure 7-1).
Decide which formatted collection you want to investigate and double-click on the collection name. The Work in Progress dialog box appears.
The first time a collection is accessed by Data Viewer, the Compute Statistics dialog box appears. At this time, Data Viewer can compute SQL and Wait statistics.
The first time you run Data Viewer on a formatted collection containing Oracle Server data, Data Viewer asks whether you want to calculate SQL statistics, Wait statistics, or both (see Figure 7-2).
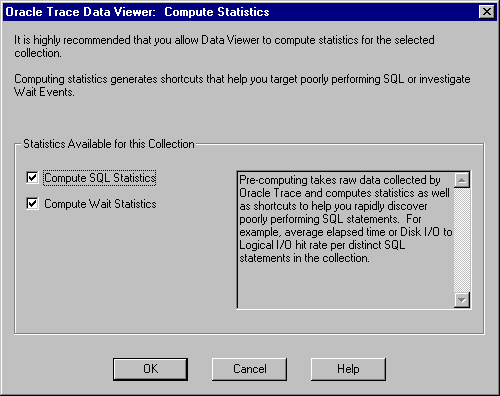
This step prepares the data for fast access and simplified problem analysis. Oracle Corporation strongly recommends that you allow this processing to occur.
|
Note: For large collections, the Computing Statistics step is time consuming. Oracle Corporation recommends that you perform this step at off-peak times. |
Data Viewer displays the predefined data views for a collection, as shown in Figure 7-3.
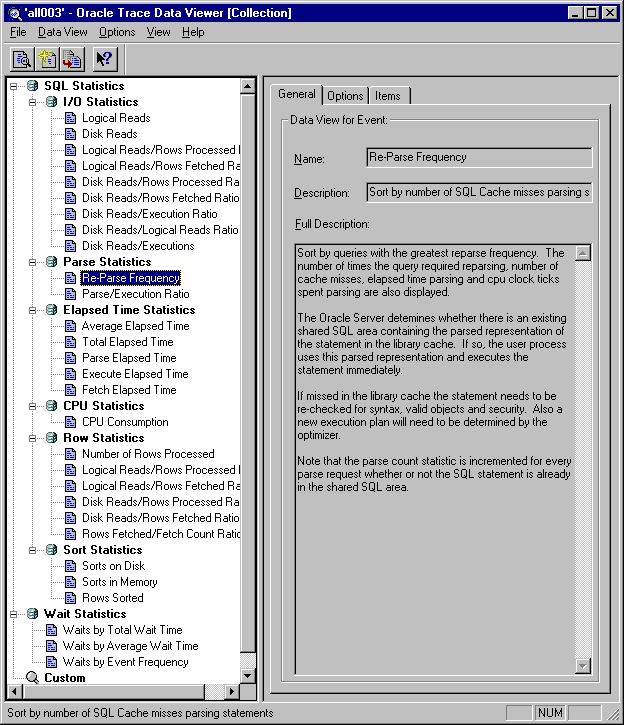
Depending on the events collected, the predefined data view list will vary. For example, the Oracle Server collection will contain predefined data views appropriate for data collected in an Oracle Server collection.
|
Note: Predefined data views reflect statistics computed for all occurrences of a distinct query within the collection (see Table 7-1.) |
If the Oracle Trace ALL class was used for the collection, Wait events will also display in the navigator tree. Unless you need to examine wait events, Oracle Corporation suggests that you collect data for the DEFAULT or EXPERT class to minimize the amount of data collected.
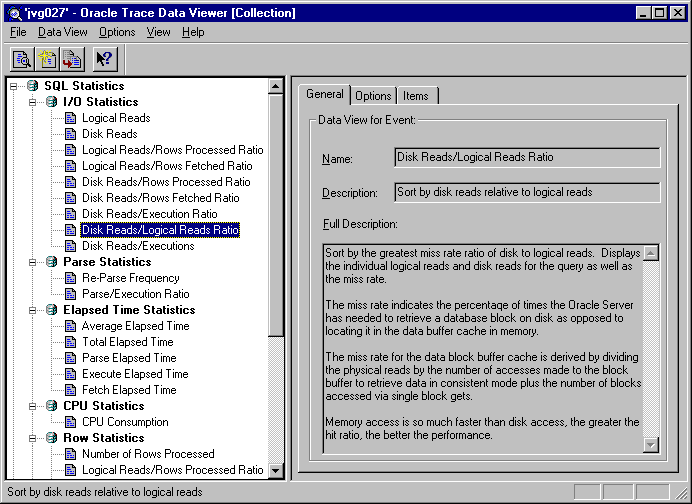
To access the definition for each data view, click on the data view name listed in the Data View Name column, for example, Disk Reads/Logical Reads Ratio. The description of the statistical data returned from the data view is on the General property page located on the right pane of the screen as shown in Figure 7-4. More details are shown in the Items and Options pages.
Displays the name, short description, and full description of the data view. For the Oracle Server predefined data views, the name reflects the name of the event. The full description is usually used to indicate what type of information is displayed in a data view and when it would be appropriate to use the data view.
Shows which statistics will be used to determine sort order, if any. Also displays the number of rows that will be selected by the data view. Limiting the number of rows to be retrieved and displayed can accelerate the display of the data.
Lists the statistics that will be displayed by the currently selected data view, as well as all possible statistics for the data view.
To examine the data defined in each data view, do one of the following:
Data Viewer then displays the data (see Figure 7-5) identified by criteria defined in the selected data view. In this example, the data view shows summary information for each SQL statement executed, sorted by the Disk to Logical Reads Ratio (for example, column name marked with asterisk (*)).
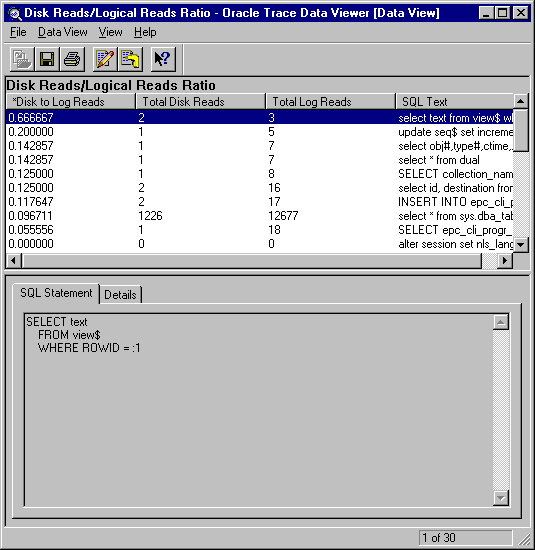
The major portions of the screen are:
The columns are displayed in the sort order determined by the value in the column marked with asterisk (*).
The SQL statement property page displays the SQL statement text for the query associated with the currently selected row of returned statistics. Note that statement text changes as you highlight various rows.
Use the right mouse button to display the popup menu that can be used to select and copy text.
The Details property page lists all statistics associated with the highlighted row in the data view. The statistics shown are for all executions of the current query within the Oracle Trace collection.
Use the right mouse button to display the popup menu that can be used to select and copy text.
|
Note: Detail statistics for SQL data views are similar to statistics presented by the TKPROF utility. |
Shows the number of rows returned and the number of the currently selected row. The status is displayed in the lower right corner of the window.
You can also create a new data view or create a data view like an existing data view. Create a data view when a predefined data view does not contain the information you want to examine. "Using the Data View Wizard" describes the process of creating a data view.
You can modify a data view to either add or remove statistics from the view.
For example, to add the "Execute rows" statistics to the data view, do the following:
The new information will be added to the view immediately. You can then save this data view to use at another time by choosing File=>Save As. The original view still exists. The modified view appears at the bottom of the navigator tree under the Custom folder.
Note that from the Data View window you can:
Changing the sort order causes the database to be queried again for the top rows using the new sort criteria.
For certain events, you can drill down to related events to refine your view of the data. The drill-down option is available if the event that is currently being shown consists of other related events. For example, when examining the SQL Statistics data views, you can drill down to the Parse, Execute, and Fetch statistics for the currently selected query.
Select a row that you wish to analyze further (see Figure 7-5) and choose Data View=>Drill down. This allows you to join this row to other events and items of interest.
Figure 7-6 shows the resulting drill-down window.
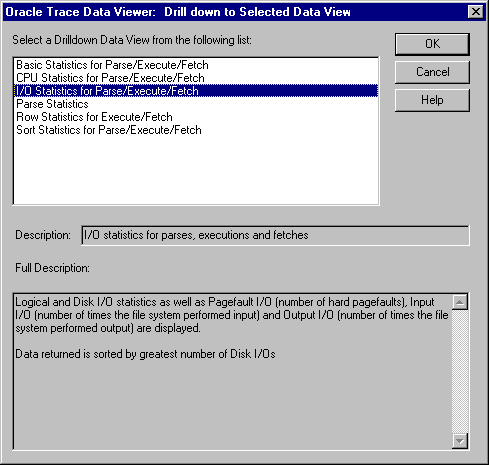
The major portions of the window are:
Predefined data views are supplied for drilling down to the individual parses, executions, and fetches associated with a selected SQL statement.
Displays a short description of the currently selected drill-down data view.
Displays a more in-depth description of the data returned by the currently selected drill-down data view, as well as a list of the statistics returned by this data view and the statistic that is used to sort it.
Select and double-click a drill-down data view to see individual parse, execute, and fetch statistics for each execution of the SQL statement within the collection. You will see the parse, execution, and fetch statistics within their own scrolling regions, as shown in Figure 7-7.
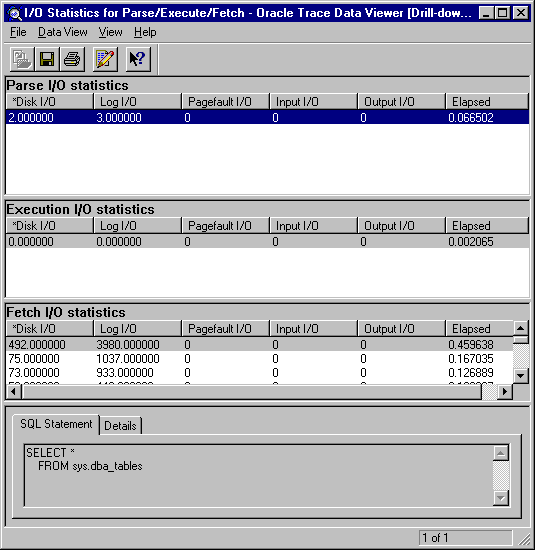
Major portions of the screen are:
Lists the detailed information returned by the data view. Each event will have columns containing statistics of items returned by the data view.
The SQL statement property page displays the SQL statement text for the query associated with the currently selected row of returned statistics.
The Details property page shows the statistics for all executions of the current query within the Oracle Trace collection.
Predefined data views are supplied for drilling down to the individual parses, executions, and fetches associated with a selected SQL statement. Table 7-2 lists the drill-down data views available in Data Viewer.
Drill-down data views can be modified and saved much like top level data views. You can modify a drill-down data view to either add or remove statistics from the view.
Because slightly different statistics are associated with the parse, execution, or fetch events, you must modify each event separately. For example, to add the "Rows" (row count) statistic to the execution and fetch output in the drill-down data view, do the following:
The new information is added to the view immediately. You can then save this data view to use at another time.
From the Data View window, you can save the current data view settings by selecting File=>Save As=>Data View. This is useful if you want to reuse this data view frequently. You must provide a name, description, and full description to save the view. Modified views are listed in the Custom folder in the navigator tree.
Also, you can save the selected rows of a data view to a file by selecting File=>Save As=>File. You can save the data in either of the following formats:
From the File menu, there are three printing options available: Print, Print Setup, and Set Printer Font.
The Print option prints the currently active portion of a data view. If the currently active region is a data area, you can print either the entire region (including rows that are not visible on the screen) or selected rows. If the currently active region is the "SQL Statement/Details" area, both the SQL Statement and the Details will be printed.
The Print Setup option displays the standard Print Setup dialog box.
The Set Printer Font option displays the standard Font dialog box with the font selection for the currently selected printer.
You can create your own customized data view by using the Oracle Trace Data View wizard (hereafter referred to as the Data View wizard).
To invoke the wizard, choose Data View=>Create or Data View=>Create Like. The wizard's Welcome page appears (see Figure 7-8).
Use the Data View wizard to examine data that you cannot find in a predefined view. However, this data will not be optimized and may take longer to process.
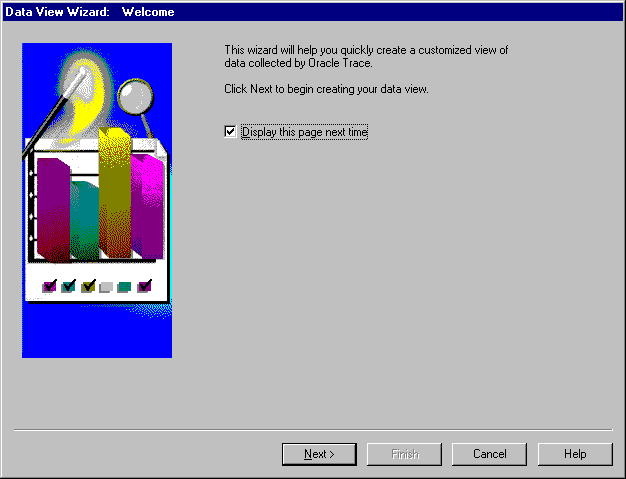
You can choose to bypass this Welcome page the next time you use the Data View wizard.
Click Next to start the definition of the data view.
The Event page is the first page used in the definition of the data view that you are creating. The Event page is as shown in Figure 7-9.
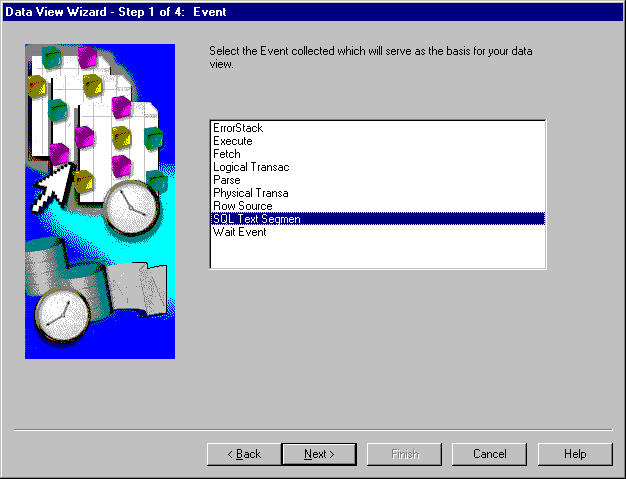
From the Event page, choose the event on which to base the data view. The list of event names comes from the Oracle Trace formatted data tables. Event names are limited to and truncated at 16 characters.
If you are looking at an Oracle Server collection and you let Data Viewer compute statistics, the SQL Text Segment event allows you to examine statistics from Parse, Execute, and Fetch events.
After you select the event, continue to the Items page by clicking Next.
On the Items page, select the items that you want to display in the data view (see Figure 7-10).
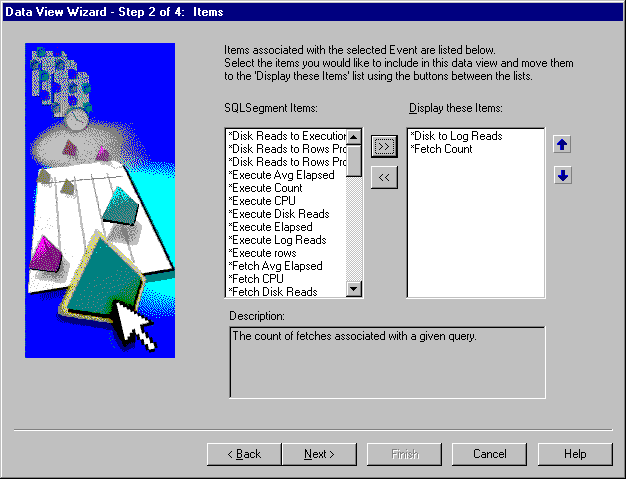
Items available are based on the event chosen.
When the item is selected, the Description field displays the description.
You must choose at least one item to generate a data view.
The next step in defining the data view is to define the sort criteria. Click Next to access the Sort By page.
The Sort By page (see Figure 7-11) allows you to choose the item or statistic on which the sorting will take place. Sort criteria is optional.
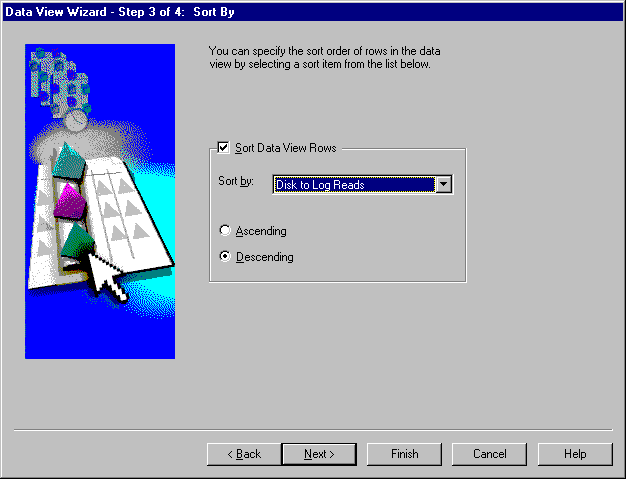
The data can be displayed in either ascending or descending order. Descending order is the default.
The next step in defining the data view is to optionally limit the number of rows to display in the data view. Click Next to access the Number of Rows page.
The last step in defining the data view is to decide how many rows are to be displayed in the data view (see Figure 7-12). You can either limit the number of rows to display or decide to display all the rows.
Limiting the number of rows returned can improve performance. If you are interested in viewing the highest value of some statistic, limit the number of rows. You can change the number for rows from the data view later on.
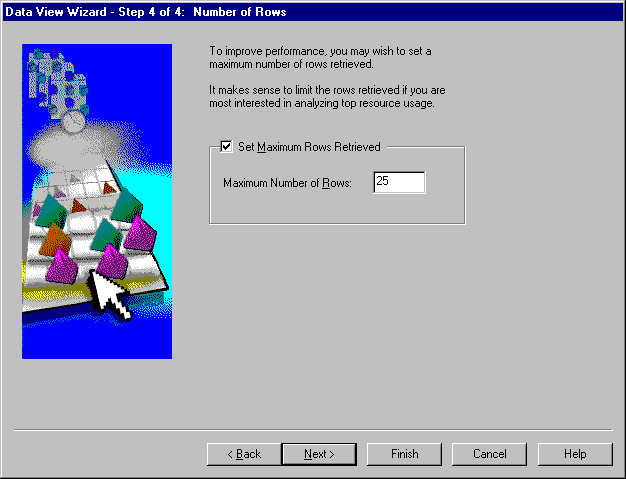
This is the last step in defining the data view. Click Next to view the Summary page.
The Summary page gives you the opportunity to review the choices that you made while defining the data view (see Figure 7-13).
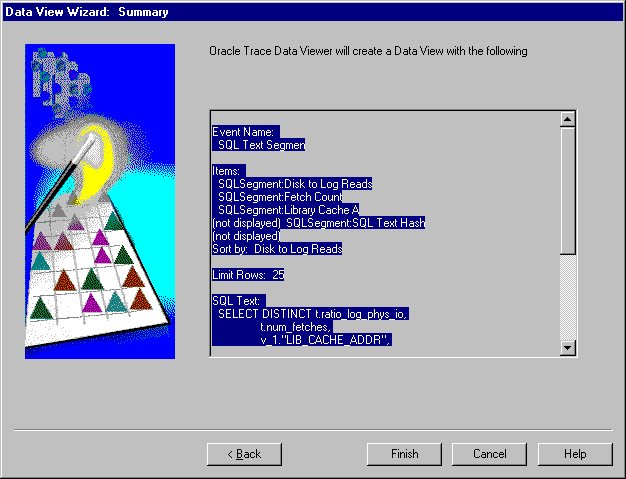
You can either accept all of the choices by clicking Finish or go back to change one or more definitions by clicking Back.
The following section deals with problems specific to Data Viewer.
To view Oracle Trace formatted data using the Data Viewer, a user account needs the following system privileges:
Data Viewer adds statistical information to your formatted data. To restore your formatted data to the exact state it was in prior to running Data Viewer, run the ORACLE_HOME\Sysman\Admin\TdvDrop.sql script. Reasons for restoring data include:
ORA-01658: unable to create INITIAL extent for segment in tablespace
MY_TABLESPACE
The first time Data Viewer views a collection, you can compute SQL statistics for all queries currently in the collection. Data Viewer does not detect new data added to a collection by a partial format while Data Viewer is viewing that collection. If you choose to partially format your collected data, you can force Data Viewer to recompute statistics using both existing and newly collected data by choosing Options=>Recompute Statistics.
If multiple collections exist in one set of user tables, computing statistics and subsequent selects may take longer than necessary. Placing a large collection in a new database user account will improve performance.
When a record is not written to the EPC_FACILITY_REGISTRATION table, the user may see an error like the following:
XP-21016: A database error has occurred:
SELECT DISTINCT FACILITY_NUMBER, FACILITY_VERSION, VENDOR
FROM EPC_FACILITY_REGISTRATION WHERE COLLECTION_ID - :1
ORA-00942: table or view does not exist
Removing the 'Filtering by User' option on collections targeting Oracle Server release 8.0.4 databases will correct this problem for future collections.
Manually adding an EPC_FACILITY_REGISTRATION record for the collection allows Trace Data Viewer to see that collection's formatted data. For example, insert EPC_FACILITY_REGISTRATION record with the following values:
Collection_ID:    123       [Look in formatted data's EPC_COLLECTION table
                             for the collection_id column value that matches
                             your collection_name]
Vendor:           192216243 [Hard code this value]
Facility_number:  5         [Hard code this value]
Facility_version: '8.0'     [or '7.3' for a collection against a 7.3 database
                             or '8.1' for a collection against an 8.1 database]
Oracle Server releases 7.3.4 and 8.0.4 and later automatically create the formatter tables. Prior to Oracle Server releases 7.3.4 and 8.0.4, you must run the otrcfmtc.sql script from Oracle Server Manager or Oracle SQL*Plus Worksheet as the user who will be formatting the data. To ensure version compatibility, use the otrcfmtc.sql script located in the ORACLE_HOME of the destination server.
The otrcfmtc.sql script is located in the $ORACLE_HOME/otracenn/admin directory (where nn represents the version of Oracle Trace).
Formatting error might be due to one of the following causes:
Look for EPC_COLLECTION.
To check for formatter tables using SQL Worksheet:
connect <username>/<password>@<service name>
describe epc_collection
To create formatter tables, execute the otrcfmtc.sql script from the ORACLE_HOME of the Oracle Server that you connected to. You only need to run this script on Oracle Server releases prior to 7.3.4 and 8.0.4.
@ORACLE_HOME/otrace/admin/otrcfmtc.sql
Here are a few suggestions to help you isolate problems in the Oracle Trace Collection Services.
To test the CLI:
To check settings on UNIX:
printenv ORACLE_HOME
printenv ORACLE_SID
To set settings on UNIX:
setenv ORACLE_HOME <path>
setenv ORACLE_SID <sid>
There should be one CLI per ORACLE_HOME. For example, if you have two Oracle Server release 7.3.3 instances sharing the same ORACLE_HOME, there should be only one CLI.
The Oracle Trace Collection Services files may be overwritten on NT by other product installations. If this occurs, your Oracle Trace Collection Services files will no longer match the version required by your Oracle Server database and you may receive a memory mapping error.
On the server node, type the following command on the operating system command line:
$ORACLE_HOME/bin/otrccol version
A .dat file and a .cdf file will be created in one of the following directories: $ORACLE_HOME/otrace/admin/cdf or the directory specified by the ORACLE_TRACE_COLLECTION_PATH parameter in your init<sid>.ora file.
If the attempt to collect Oracle Trace data for an Oracle7 database results in the message "Error starting/stopping Oracle7 database collection," this may be due to missing database stored procedures that Oracle Trace uses to start and stop Oracle7 collections.
To check for stored procedures using the Oracle Enterprise Manager console, use the Navigator and the following path:
Networks=>Databases=><your database>=>Schema Objects=>Packages=>SYS
Look for stored procedures starting with DBMS_ORACLE_TRACE_xxx.
To check for stored procedures using Oracle Server Manager or Oracle SQL*Plus Worksheet:
select object_name from dba_objects where object_name like '%TRACE%'
and object_type = 'PACKAGE';
OBJECT_NAME
DBMS_ORACLE_TRACE_AGENT
DBMS_ORACLE_TRACE_USER
2 rows selected.
Prior to Oracle Server release 8.0.3, Oracle Trace required that stored procedures be installed on the database. These SQL scripts may be automatically run during database installation depending on the platform-specific installation procedures. If they are not executed during database installation, you must run these scripts manually. You can add these stored procedures to the database by running the otrcsvr.sql script from $ORACLE_HOME\otracenn\admin on NT ($ORACLE_HOME/otrace/admin on UNIX) from a privileged database account (SYS or INTERNAL). To run the script, set the default to the path were the script is located. This script runs other scripts that do not have the path specified. These other scripts fail if you are not in the directory where these scripts will run.
The EPC_ERROR.LOG file provides information about the collection processing, specifically the Oracle Trace Collection Services errors.
The EPC_ERROR.LOG file is created in the current default directory.
For general information about causes and actions for most Oracle Trace messages, see the Oracle Enterprise Manager Messages Manual
If you have tried all the previously described suggestions and Oracle Trace is still not working, please call your local Oracle World Wide Support Center. When reporting a problem, have the following information available:
|
 Copyright © 1996-2001, Oracle Corporation. All Rights Reserved. |
|