Release 2 (9.2)
Part Number A96629-01
Home |
Book List |
Contents |
Index |
 Master Index |
 Feedback |
| Oracle9i Data Guard Broker Release 2 (9.2) Part Number A96629-01 |
|
This chapter provides several scenarios that show how to use the Oracle9i Data Guard Manager graphical user interface (GUI) to create, manage, and monitor a broker configuration.
This chapter contains the following scenarios:
Start Data Guard Manager through the Oracle Enterprise Manager Console by taking the following steps.
Start the Oracle Management Server from the command-line prompt by entering the oemctl start oms command.
Launch Oracle Enterprise Manager at the command-line prompt by entering the oemapp console command. When the Enterprise Manager Console login dialog displays, you must select Login to the Oracle Management Server. Do not select Launch standalone, because Data Guard Manager will not be available from the Enterprise Manager Console if you select this option.
The Intelligent Agent must be running for Data Guard Manager to discover nodes, execute jobs and monitor events. Follow the directions in the Oracle Intelligent Agent User's Guide to configure and use the Intelligent Agent on the primary and standby nodes.
Run the Enterprise Manager Discovery wizard, also referred to as the Discovery wizard, to discover the primary and standby nodes and gain access to the databases that you want to configure and administer with Data Guard Manager. To invoke the Discovery wizard from the Enterprise Manager Console menu bar, select Navigator > Discover Nodes.
Follow the directions in the Discovery wizard. When finished, all discovered nodes and databases are displayed in the Enterprise Manager navigator tree:
You should set Preferred Credentials on both the primary and standby nodes to ensure Data Guard Manager can run remote processes to create the configuration. To set Preferred Credentials from the Enterprise Manager Console menu bar, select: Configuration > Preferences > Preferred Credentials.
Although setting Preferred Credentials for the databases is not required, you might want to set Preferred Credentials for the primary database and for the standby database if you are adding an existing standby database.
You can start Data Guard Manager from the Enterprise Manager Console or at the command-line prompt:
oemapp dataguard command.Figure 5-1 shows both methods of starting Data Guard Manager from the Enterprise Manager Console.
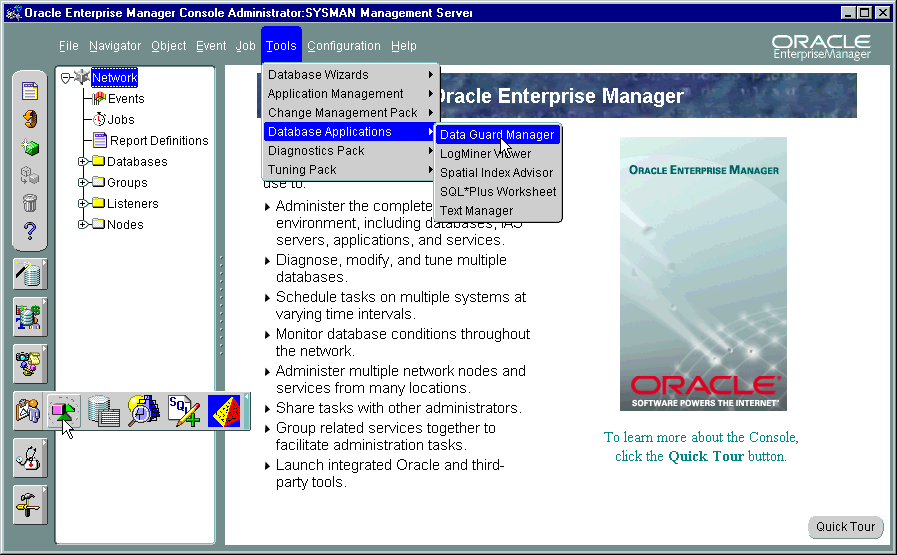
Text description of the illustration oemlaunch.gif
When launched, Data Guard Manager displays the informational page shown in Figure 5-2.
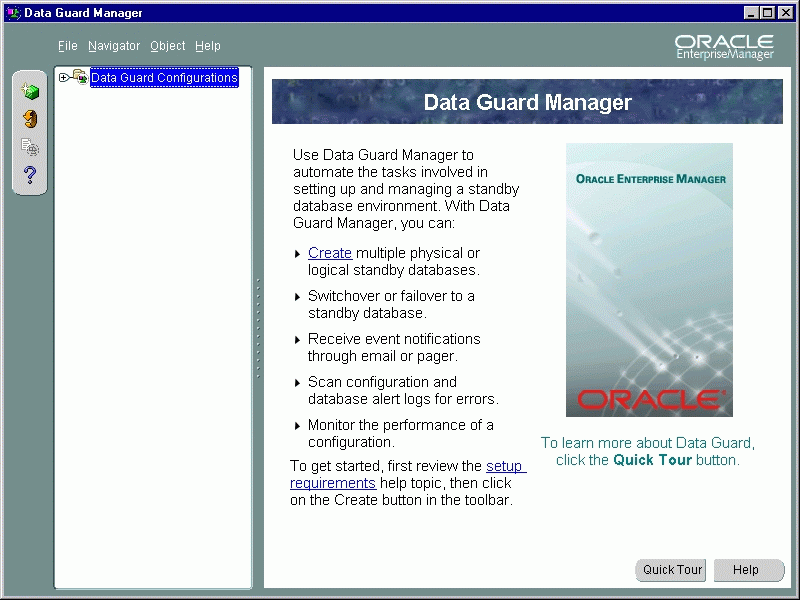
Text description of the illustration dgwelcome.gif
On this page, you can:
Creating a broker configuration is the first thing you must do before you can manage and monitor the databases. Data Guard Manager provides the Create Configuration wizard to create a broker configuration that includes a primary database and one standby database. (You can use the Add Site wizard later to add more sites. See Section 5.5.) To start the Create Configuration wizard, right-click Data Guard Configurations in the navigator tree and choose Create Configuration wizard.
The wizard takes you through the following steps:
The following steps create a configuration and create a new physical standby database. It shows how the wizard takes you through additional steps to select the Oracle home for the database and to copy datafiles to the standby site.
Before the Create Configuration wizard steps you through the process of creating a broker configuration, you must ensure some basic configuration requirements have been met on the primary and standby nodes.
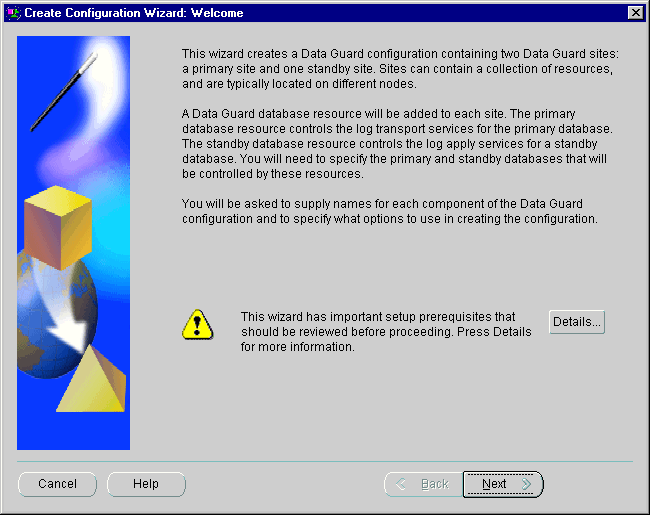
Text description of the illustration crwiz_welcome_bottom.gif
The next dialog asks you to provide the name of the new broker configuration. Each configuration name must be an Oracle identifier that is unique among the configurations that you have created with Data Guard Manager.
Figure 5-4 shows the Configuration Name step in which a new configuration, Sales, is named.
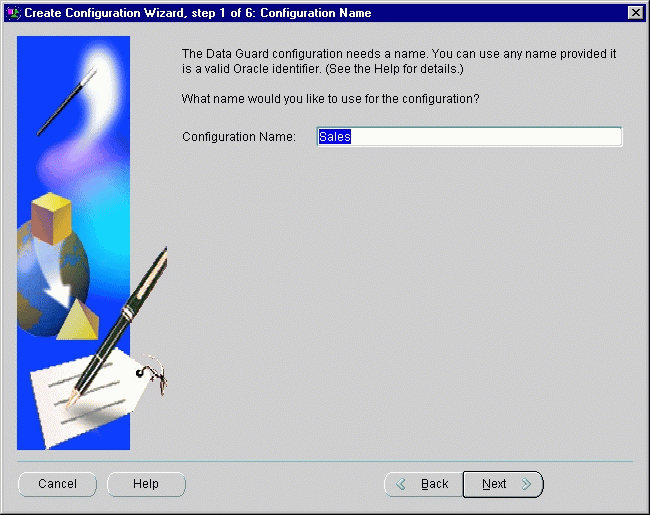
Text description of the illustration crwiz_configname.gif
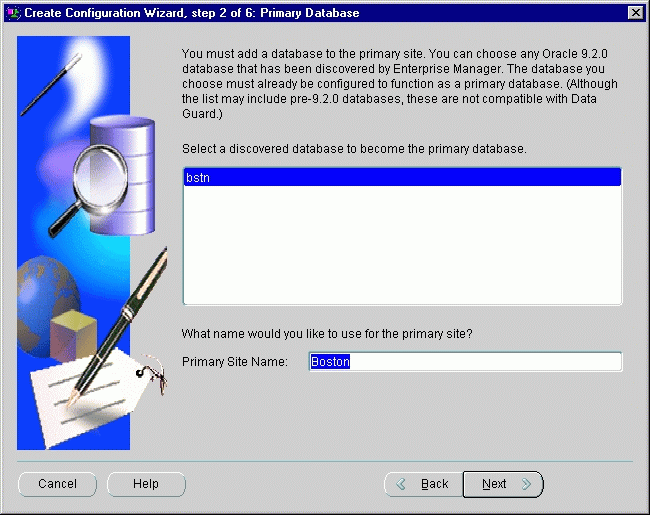
The list of discovered database instances listed on this page contains all of the instances that have been discovered through the Enterprise Manager Console Discovery wizard. (These instances were discovered during the setup work performed in Section 5.1 in the step titled, "Discover the primary and standby nodes.")
Text description of the illustration crwiz_primarydb.gif
To select a primary database, select the Oracle9i database instance that you want to serve in the role of a primary database for this broker configuration. The database instance that you choose must be release 9.2 or greater, and it must be a primary database, such that the CONTROLFILE_TYPE in the V$DATABASE view is equal to CURRENT.
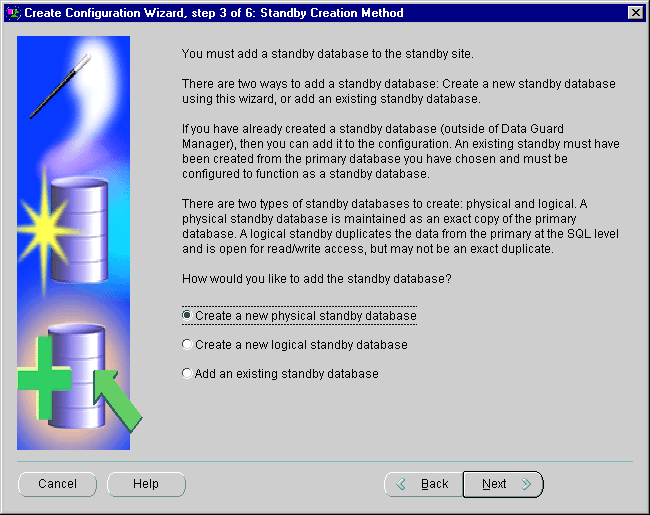
The wizard allows you to create a new physical or logical standby database or add an existing standby database.
This scenario will create a new physical standby database, as shown in Figure 5-6.
Text description of the illustration crwiz_standbycreatemethod.gif
If you choose to add an existing standby database, the wizard displays a list of discovered database instances from which you select a physical or logical standby database to import into the broker configuration. The wizard connects to the database that you choose.
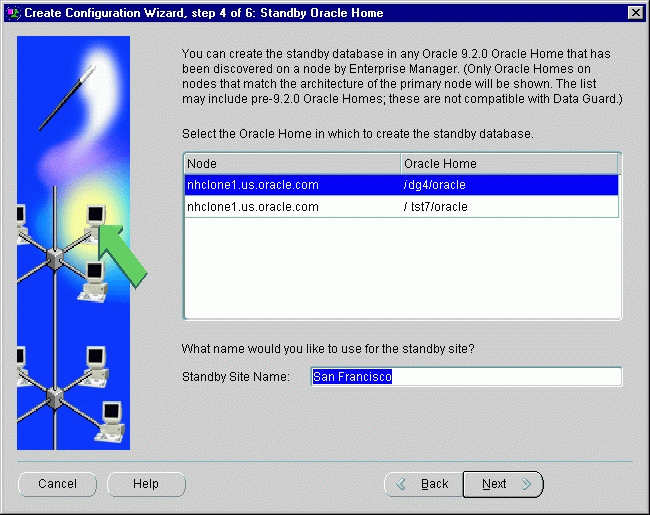
If you choose to create a new standby database, the wizard asks you to select the Oracle home on the standby node in which you want to create the standby database.
The wizard lists all of the Oracle homes that have been discovered through the Enterprise Manager Discovery wizard. You must select a discovered Oracle home and provide a unique name for the standby site.
Figure 5-7 shows this step of the configuration process.
Text description of the illustration crwiz_standbyoraclehome.gif
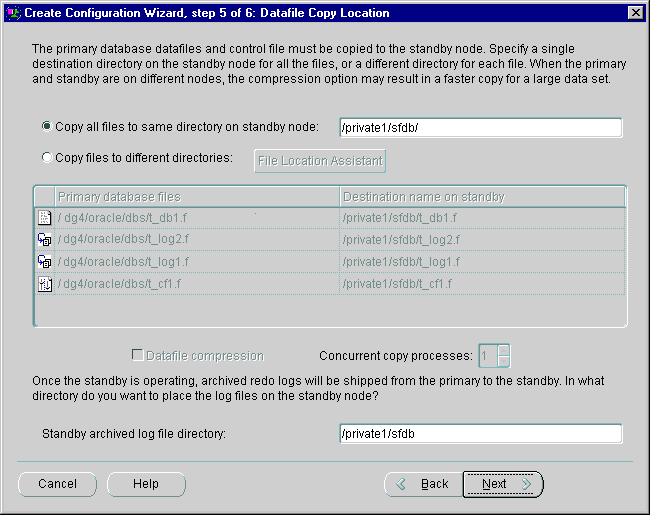
If you choose to create a new standby database, part of the creation process involves copying the datafiles for the primary database to the standby node. Data Guard Manager uses the operating system (OS) method to copy the files.
As you enter the destination directory, the wizard assumes you want the archived redo logs in the same directory as the rest of the datafiles. and mirrors your input to the Standby archived log file directory field at the bottom of the page. Figure 5-8 shows this step of the configuration process.
Text description of the illustration crwiz_standbydatafilecopylocation.gif
Copy all files to the same directory on the standby node: Specify a single directory on the standby node. All files for the new standby instance will be copied to this directory. If the directory you specify does not exist on the standby database, Data Guard Manager will ask if you want to create the new directory and automatically create it. (As you enter the destination directory, it is mirrored to the standby archived redo log file directory field at the bottom of the dialog.)
Copy files to different directories: You can specify individual destination directories on the standby node for each file. Enter each directory separately, or click File Location Assistant to automatically generate directory names. If a directory you specify does not exist on the standby database, Data Guard Manager will ask if you want to automatically create the directory.
Datafile compression: If the new standby database instance is located on a different node than the primary database, you can choose compression for the datafile copy. Depending on the composition of the datafiles, compression may result in a faster copy process, especially for large databases.
Concurrent copy processes: If the new standby database instance is located on a different node than the primary database, you can optionally specify up to 10 concurrent copy processes. Increasing the number of copy processes may result in a faster copy time for a large dataset. This option is available only on UNIX systems.
Standby archived log file directory: Specify a path name for the location on the standby node where you want log transport services to copy archived redo logs. Because archived redo logs sometimes require a large amount of space on the standby node, you might want to specify a different destination location from the datafiles. The default destination is the directory that you specified in the "Copy all files to the same directory on the standby node" text box at the top of this page.
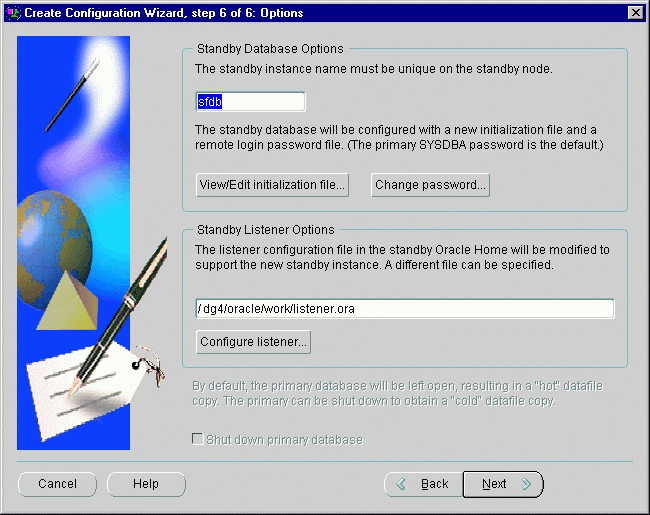
This page of the wizard provides several last-minute tuning opportunities. Normally, no input is necessary on this page because all parameters are set automatically. However, you can optionally change the following:
Figure 5-9 shows the Options dialog.
Text description of the illustration crwiz_options.gif
Although you do not have to provide any input, you can optionally make changes to any of the fields. Table 5-1 describes the default values for each field and includes comments about how the information is used.
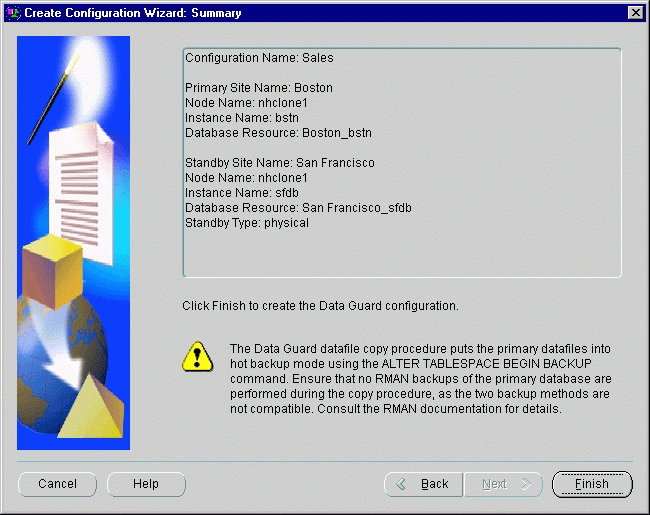
Next, the wizard displays a summary page on which you can verify the information that you provided to the wizard. If you find an error or decide to rename something, click Back to move backward through the screens in the wizard. Otherwise, click Finish to begin creating the configuration.
Figure 5-10 shows the summary page.
Text description of the illustration crwiz_summary.gif
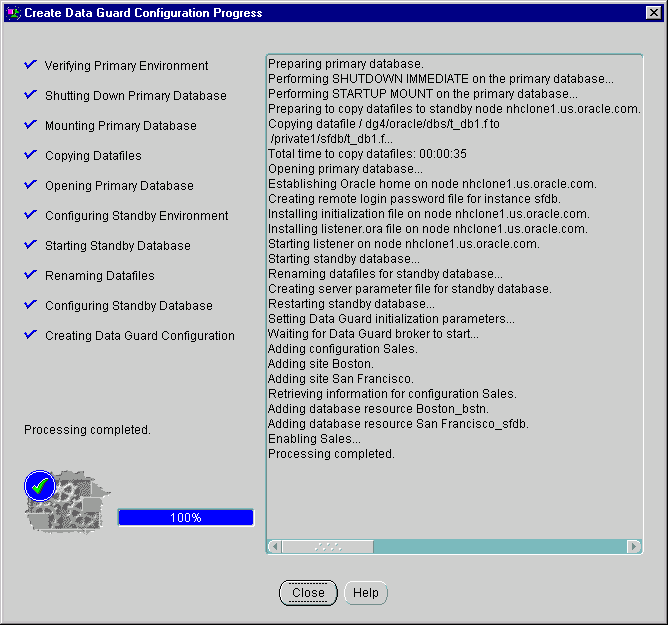
After you finish providing input to the wizard, Data Guard Manager opens a dialog box (shown in Figure 5-11) to display the wizard's progress as it creates the new configuration. The progress information that is displayed varies depending on if you are importing an existing standby database or creating a new standby database.
The progress dialog window displays the progress of the operation. Click Close when the create operation is done to close the progress dialog window and return control to the Data Guard Manager main window.
Figure 5-11 shows the progress dialog after the successful creation of the configuration named DGConfig.
Text description of the illustration crwiz_prog_complete.gif
When the Create Configuration wizard completes, a To Do list is displayed describing a few tasks you must perform to finish configuring the broker configuration. Follow the instructions in the list to complete the tasks.
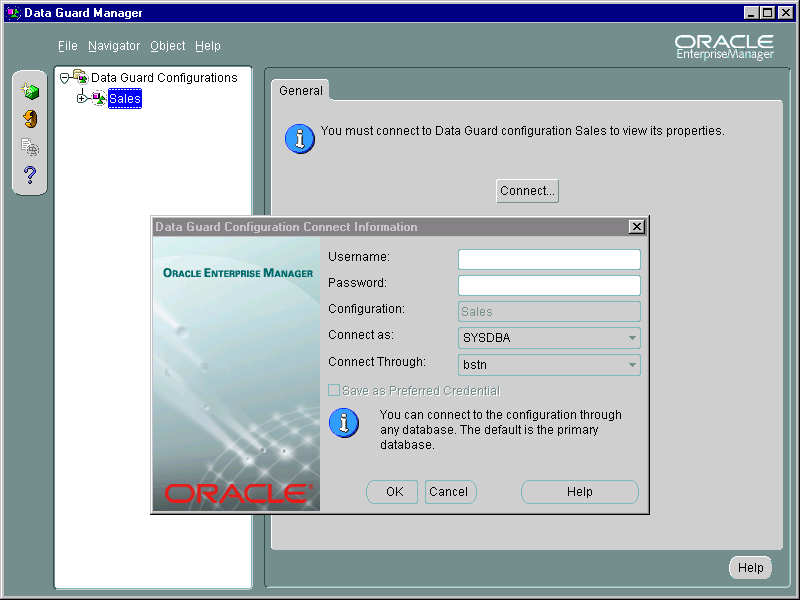
You must connect to the new configuration (created in Section 5.2) through the Data Guard Configuration Connect Information dialog box to manage and monitor the resources in it. You can connect through either the primary or a standby database.
To connect, double-click the configuration name in the navigator tree; this launches the Data Guard Connect Information dialog box shown in Figure 5-12.
Text description of the illustration dgconnect.gif
If you require full management access (including the ability to add and remove sites and database resources, and to perform switchover and failover operations), connect using an Administrator account that has SYSDBA privileges. For read-only access to the configuration for monitoring purposes, you can connect as NORMAL. See the online help for more information about connecting to the configuration.
By default, the configuration, site, and resource objects are automatically enabled and the primary and standby database systems are online when you create a configuration. When the configuration is enabled, it means that you can manage and monitor all of the objects because they are under the control of Data Guard broker.
Use the Verify operation when you first create a configuration and at any time you want to perform a series of validation checks on the broker configuration, including a health check of each site and resource in the configuration.
Figure 5-13 shows how the Verify operation:
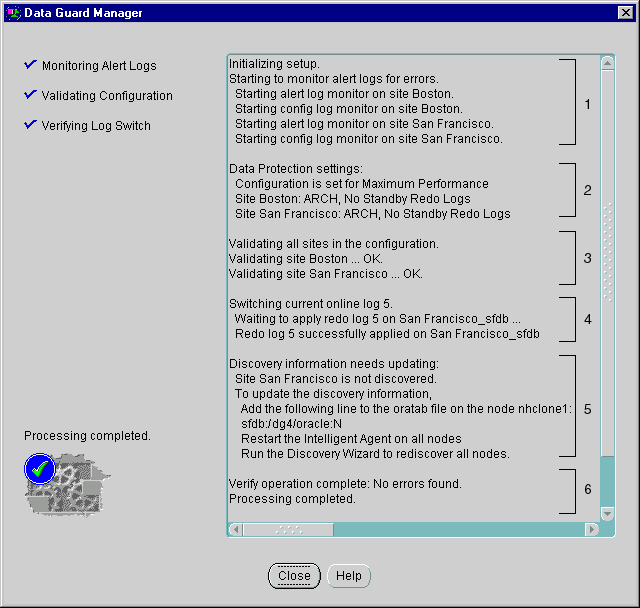
Text description of the illustration verifyconfig_warning.gif
The Verify operation shown in Figure 5-13 was successful because the archived redo logs were applied on all standby databases. The progress dialog displays a blue check mark in the status area (left of the dialog) if the Verify operation is successful.
You can use the Add Site wizard to add up to 8 additional standby sites, one at a time, to an existing broker configuration. You can choose to create or add existing (physical or logical) standby databases. Many of the tasks you perform with the Add Site wizard are similar to the steps you performed with the Create Configuration wizard in Section 5.2
To start the Add Site wizard, right-click the configuration in the navigator tree and select Add Site. The Add Site wizard guides you through the following steps:
In addition, if there is no current connection to the primary database and you do not have Preferred Credentials set for the primary database in the current Enterprise Manager session, Data Guard Manager might prompt you to connect to the primary database.
The following figures highlight some of the pages you will see when you use the Add Site wizard. Figure 5-14 shows how you create a new logical standby database.
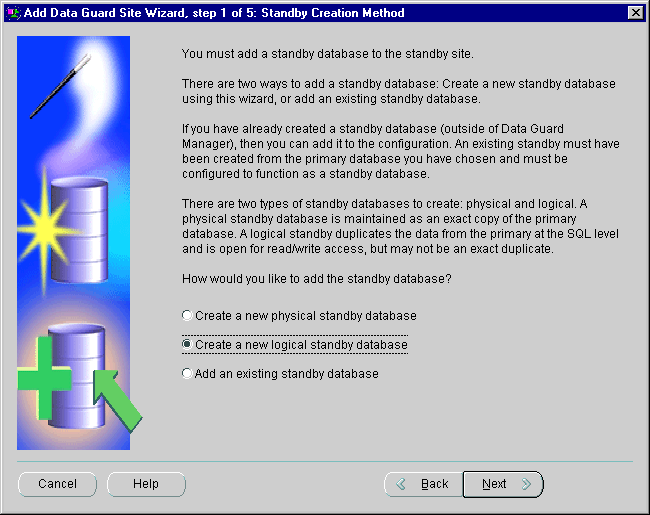
Text description of the illustration as_createstandby.gif
When you create a logical standby database, the wizard lists datatypes and tables in the primary database that the logical standby database cannot support. Although log apply services will automatically exclude unsupported datatypes or tables when applying the archived redo logs to the logical standby database, you should examine the list to determine if any critical tables exist on the primary database that must be maintained on the logical standby database. If so, you should consider creating a physical standby database instead of a logical standby database. Otherwise, you can continue creating the logical standby database.
Figure 5-15 shows an example of many unsupported objects on the Logical Standby Support page.
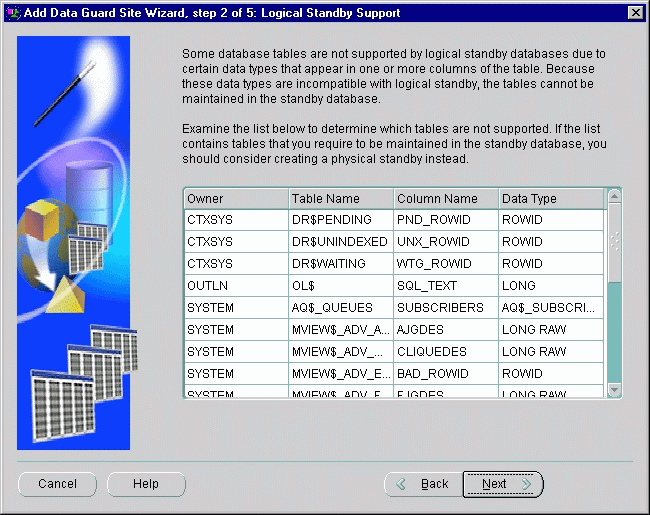
Text description of the illustration as_logicalstandbysupport.gif
As with the Create Configuration wizard, you are prompted to select an Oracle home on the standby site, and specify a datafile copy location or locations. After you verify your input to the Add Site wizard on the Summary page, the wizard automatically creates the logical standby database, and adds it to the broker configuration.
The following list describes the progress dialog shown in Figure 5-16:
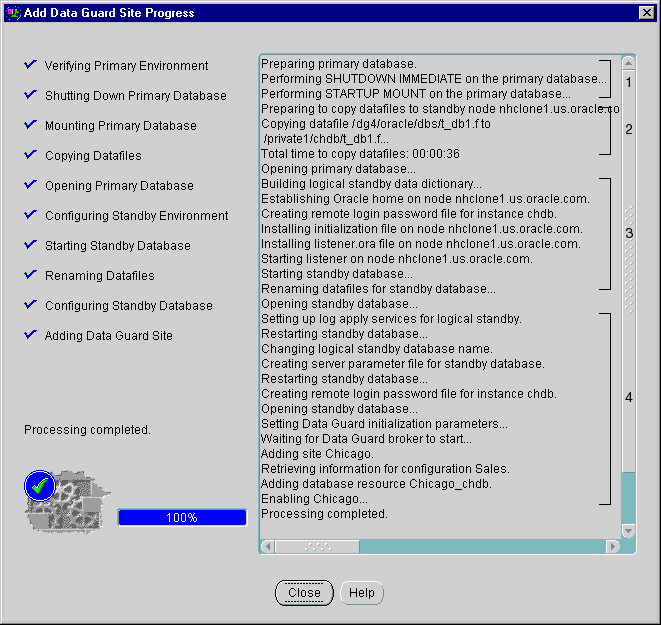
Text description of the illustration as_logicalprogress.gif
Data Guard Manager can help simplify some of the routine maintenance tasks you must perform in the configuration. The following sections provide two examples: one shows how to take a site offline to replace a faulty disk drive.
This section describes how to take the standby database resource offline for the purpose of replacing a faulty disk drive.
To change the state of the standby database to be offline, follow these steps:
When changing the state of any database to offline, you also need to click Yes in the pop-up dialog box that displays to confirm that you want to change its state.
When you change the state of the standby database to offline, the standby database instance will be put into a started, nomount state and log apply services will be stopped. This temporarily pauses the transmission of redo logs to this site and also the application of the archived redo logs to the standby database while you replace the faulty disk drive. After completing your maintenance tasks, you can follow the same sequence of steps to bring the database online again.
|
Note: Taking any object offline should be done only when absolutely necessary, because it will perform a |
Figure 5-17 shows the Set State dialog on which you will change the state of the standby database to offline.
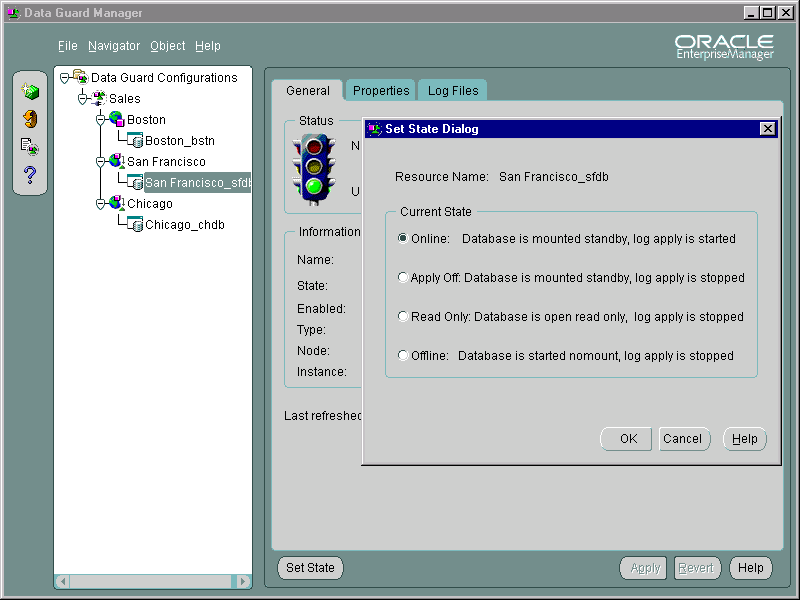
Text description of the illustration physstdby_states.gif
You can change the protection mode properties with Data Guard Manager at any time to modify and tune your current configuration.
When the configuration was first created it was placed in the maximum performance mode by default. This section describes the 4-step process for upgrading to the maximum protection mode. The maximum protection mode offers the highest level of data protection for the primary database because all data that has been committed on the primary database is guaranteed to be recoverable on properly configured physical standby sites in the event of a failure.
To set the maximum protection data protection mode:
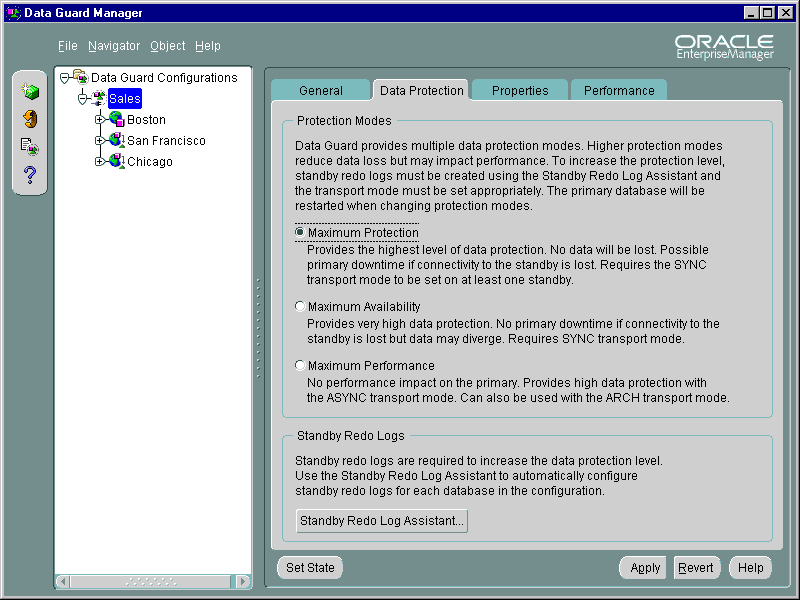
Text description of the illustration prot_modes.gif
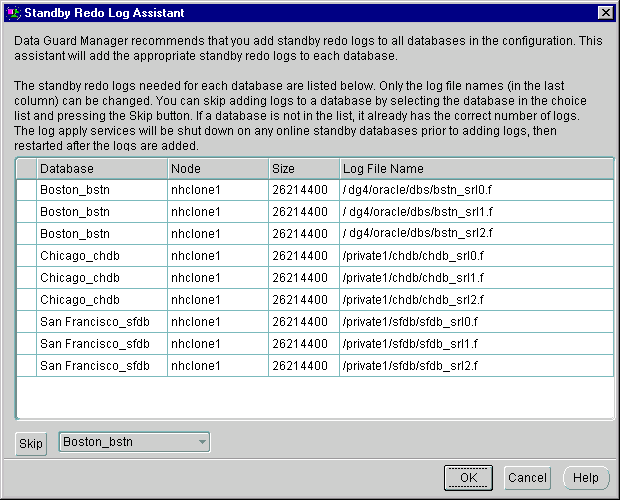
Text description of the illustration srl_assist.gif
The Standby Redo Log Assistant automatically determines the correct number and size of standby redo logs needed for all databases in the configuration, and adds those logs using the directory locations you specify. You can optionally click Skip to avoid adding standby redo logs to one or more specific databases. See the Data Guard Manager help system for more information.
LogXptMode property value appropriately for the data protection mode you chose in step 1. The maximum protection mode requires that you configure the value of the LogXptMode database property to SYNC on at least one physical standby site. To set the LogXptMode:
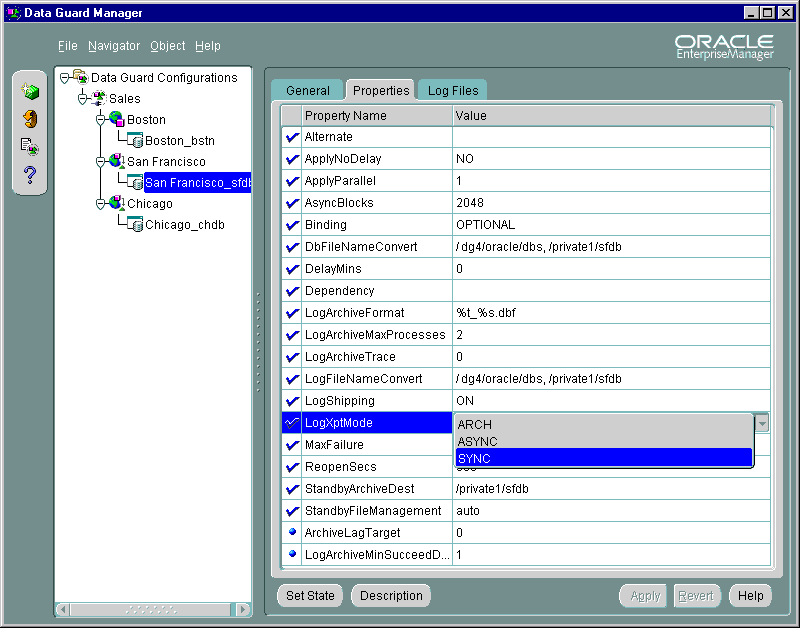
You can change database properties at any time in Data Guard Manager. Plus, when you set definitions or values for database properties in the broker configuration, the broker records the change in the configuration file and also propagates the changes to the related initialization parameters in the SPFILE files throughout the configuration.
| See Also:
Section 4.3.2 for complete information about configurable database resource properties |
There may be occasions when you might want to perform a switchover operation between the primary database and standby databases. This scenario steps you through the process of using the Switchover wizard to switch roles between the primary site and a standby site.
To start the Switchover wizard, use either of the following methods:
The Switchover wizard displays a welcome screen and performs the following steps:
SHUTDOWN IMMEDIATE command if you do not shut them down yourself.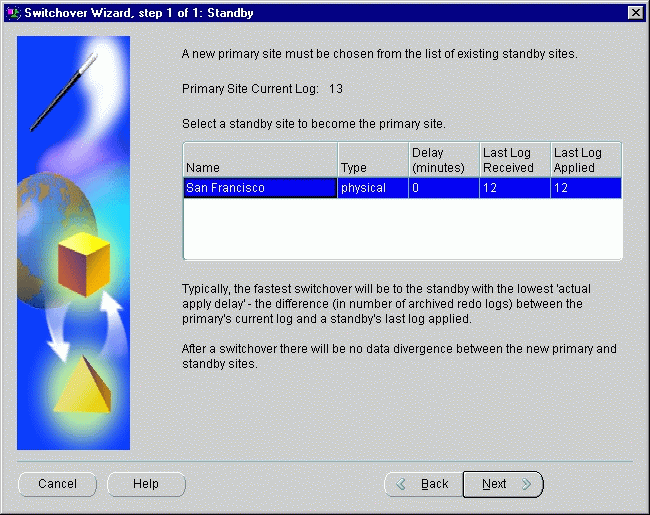
This scenario steps you through the process of using the Failover wizard to transition one of the physical standby sites, San Francisco, into the primary role. You should perform a failover operation only in the event of a software or system failure that results in the loss of the primary database. The primary database is discarded and the standby database assumes the primary database role.
In Figure 5-22, the configuration General page shows the ORA-16625 status that indicates problems accessing the primary database.
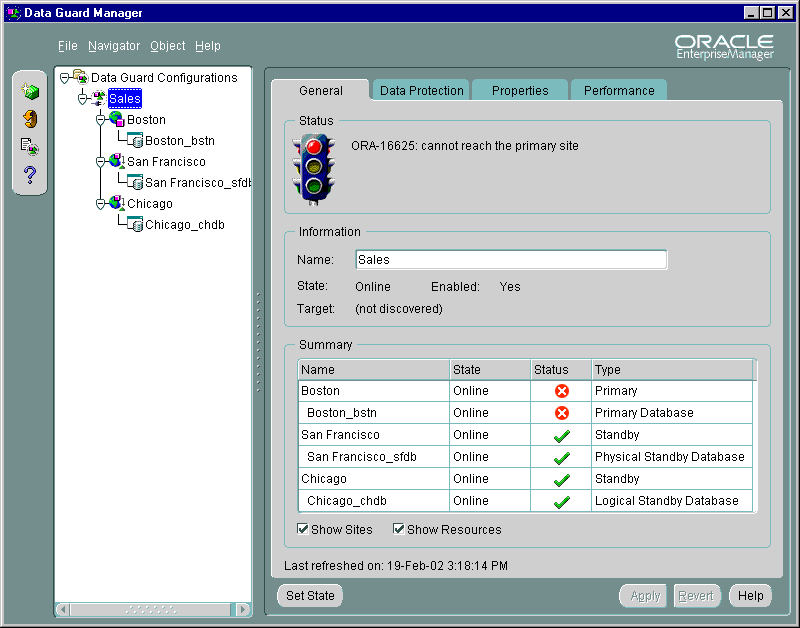
Text description of the illustration fo_genconfig_before.gif
If you determine that a failure has occurred on the primary database and there is no possibility of recovering the primary database in a timely manner, you can start the Failover wizard by selecting Failover on the Object menu. Oracle Corporation recommends that you always choose a physical standby database (over a logical standby database) as the target of a failover operation.
The Failover wizard displays a welcome screen and performs the following steps:
Figure 5-23 lists existing standby sites and prompts you to choose the one you would like to have serve as the new primary site.
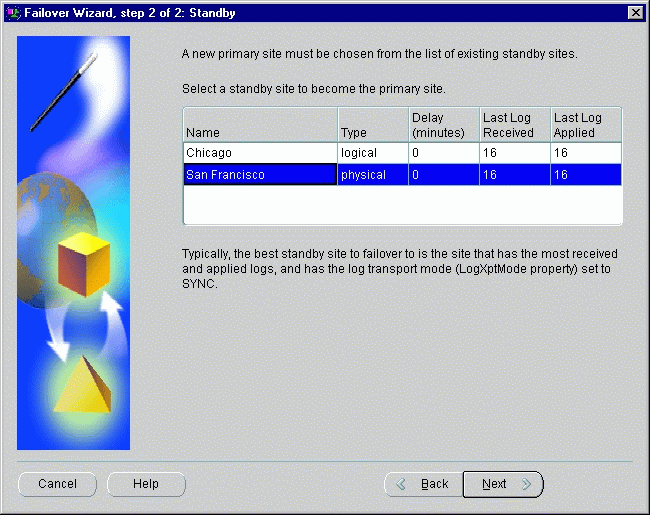
Text description of the illustration fo_picknewprimary.gif
During the failover operation, the wizard opens a window to display the progress of the operation as it transitions the selected standby site into the primary role and restarts all online physical standby database instances involved in the failover operation. When completed, the configuration General page reflects the updated configuration, as shown in Figure 5-24.
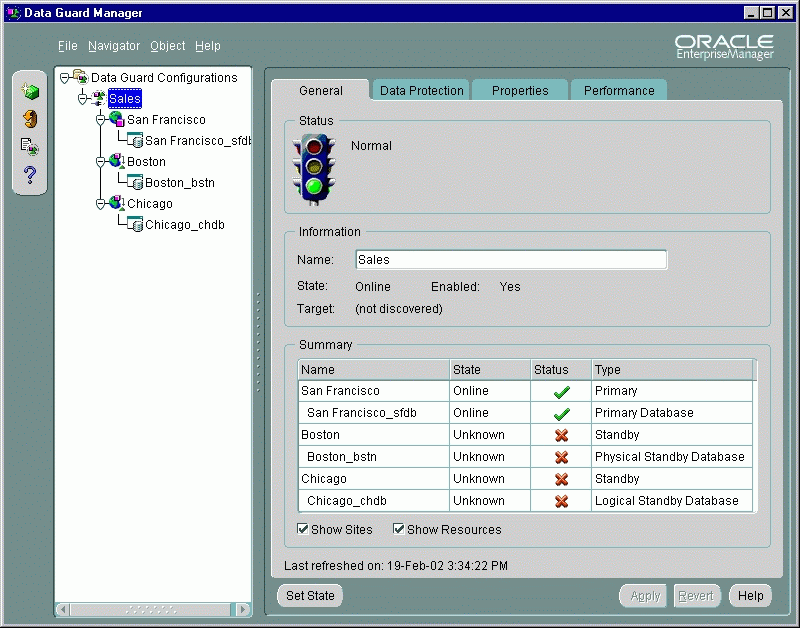
Text description of the illustration fo_genconfig_after.gif
In the figure, a red X is displayed in the Status column to indicate that the original primary database (Boston) and the logical standby database (Chicago) are both permanently disabled and can no longer be managed through Data Guard Manager.
A graceful failover operation attempts to bring along any physical bystanders. However, when the graceful failover operation involves a logical standby database, you must re-create the original primary database and any logical bystanders. Also, you must stop and restart the Intelligent Agent and use the Discovery wizard from the Enterprise Manager Console to rediscover all nodes in the configuration.
| See Also:
Chapter 3 for more information about failover operations |
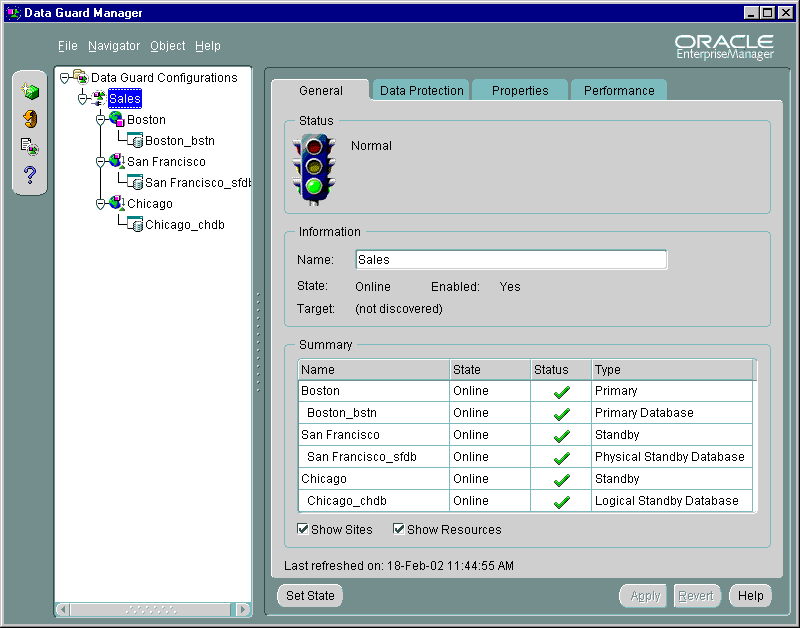
Data Guard Manager provides several ways to monitor the status of a configuration as well as the redo log activity of the primary and standby databases. At the most basic level, the General tab for the configuration not only displays information about the configuration, but it also includes summary information about its sites and database resources.
For example, the summary information on the General property page shows the states and status for all of the sites and databases in the configuration. If you want to find out more information about why a standby database resource is offline, select it in the navigator tree and view the database resource's property pages. Any Data Guard specific database properties that are incorrect, inconsistent or known to be in conflict with other parameters will be flagged with a warning in the Properties page for the database resource.
For example, hovering over a yellow warning icon displays the message "A yellow warning indicates an inconsistent property has been detected. The value for this property is inconsistent between Data Guard and the database, Data Guard and the SPFILE, or Data Guard and both the database and SPFILE."
Figure 5-25 shows the General property page for the configuration.
Text description of the illustration genconfig.gif
Another way to quickly check the overall health of a broker configuration is to run the Verify command. The Verify command performs a series of validation checks on the broker configuration, including a health check of each site and database resource object in the configuration. The checks include:
To verify the configuration, right-click the configuration in the navigator tree and select Verify from the drop-down list. The Verify command displays a progress dialog (see Section 5.4, "Scenario 4: Verifying the Configuration" for an example). When the verify operation completes successfully, the broker configuration is healthy, guarding the data and ready for a switchover or failover operation.
The View Log dialog allows you to display the database alert logs, the Data Guard configuration logs, or both logs for the primary and standby sites. Use it for rapid error searches and monitoring because you can obtain results quickly, if common Oracle errors or specific patterns.
To use the View Log dialog:
In addition, you can use the F3, F7 and F8 keys for rapid searching in the logs. Choose Matching common Oracle errors to view a subset of errors discovered in the logs. Choose Match Regular Expression to perform a search on specific words in the logs. Click OK.
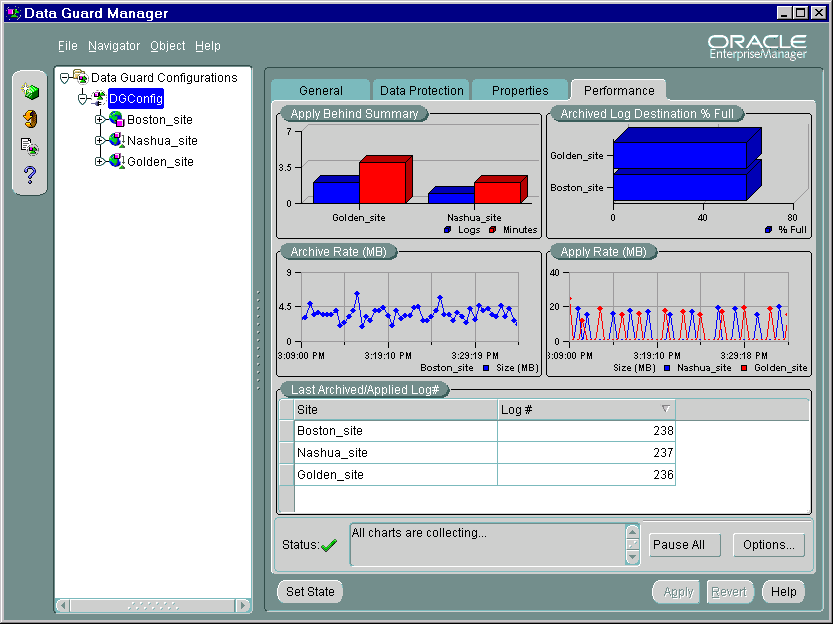
For more in-depth performance and monitoring, you can display detailed performance statistics for a broker configuration using performance charts that provide a graphical summary of all redo log activity in the configuration. The charts are refreshed based on a collection interval (the rate at which data is sampled from the primary database) that you can specify. The default collection interval is 60 seconds, which can be changed. See the online Help for detailed information about performance sampling rates.
For example, Figure 5-26 shows performance information for all of the objects in the configuration.
Text description of the illustration perf_loggaps.gif
The Performance page begins charting information as soon as the page is displayed. The charts run continuously while the configuration is selected in the navigator tree, even if you go to another page for the configuration. For example, if you click the General, Data Protection, or Properties tab, the charts continue collecting data and be up-to-date when you return to the Performance tab. The Performance page stops collecting data when you click Pause All at the bottom of the page, disconnect from the configuration, or select another object in the tree view. Also, data will not be collected for any offline or disabled sites. For example, if the primary site is offline, no charts will be displayed for it.
.From the Performance page, click Options to access the Performance Chart Options dialog that allows you to customize display settings on the Performance page or invoke a Test Application that modifies a test table and generates redo to test the configuration setup.
The Test Application is a good way to make sure that the configuration is set up and functioning properly before using live data and to test relative performance.
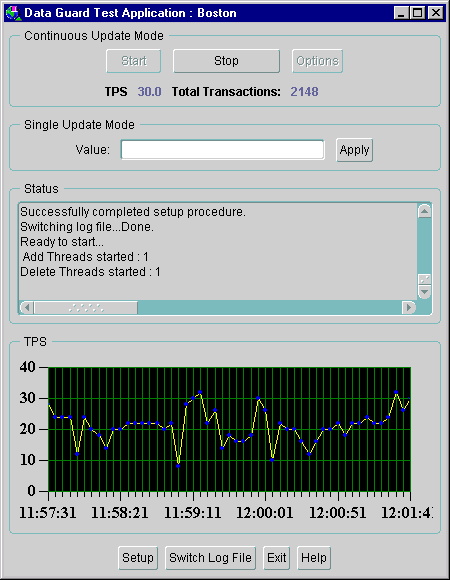
You use the Test Application dialog (shown in Figure 5-27) to help you evaluate the performance of your broker configuration by adding and deleting rows in a test schema on your primary database. To set up a Test Application, perform the following steps:
Single Update Mode inserts one row of the value you specify into the Test Application. To use Single Update Mode:
On the primary database:
On the physical standby databases:
On logical standby databases:
When the value from the primary database is inserted into the standby database, the value will appear in the Test Value text area of the Test Application started on the logical.
Continuous Update Mode inserts a number of insert and delete threads in the Test Application. To set it up, select Options in the Continuous Update Mode section of the Test Application page and enter the number of Insert and Delete threads.
More threads will produce more transactions resulting in more log traffic. The Test Application will run until you click Stop or until there is a lack of resources. There are no restrictions on how many threads may be started and it is possible to exceed the hardware or database resource limits (which can also be a very useful test).
Figure 5-27 shows the Test Application dialog for setting up single or continuous update mode tests.
Text description of the illustration test_app.gif
The test application plots the number of transactions per second (TPS) in a graph, providing a profile of the performance impact of the simulated archived redo log traffic. By using the Test Application, you can determine how different settings may affect overall performance. For example, you might want to test the effect of the different protection modes: maximum protection, maximum availability, and maximum performance.
.|
Note: The performance information is for the Test Application only. You may see different results based on different applications and other factors when you run different tests. |
In addition to monitoring the status and log activity using Data Guard Manager, you can register event tests with Oracle Enterprise Manager to monitor the redo log activity on the primary and standby databases or monitor the status of the configuration as a whole.
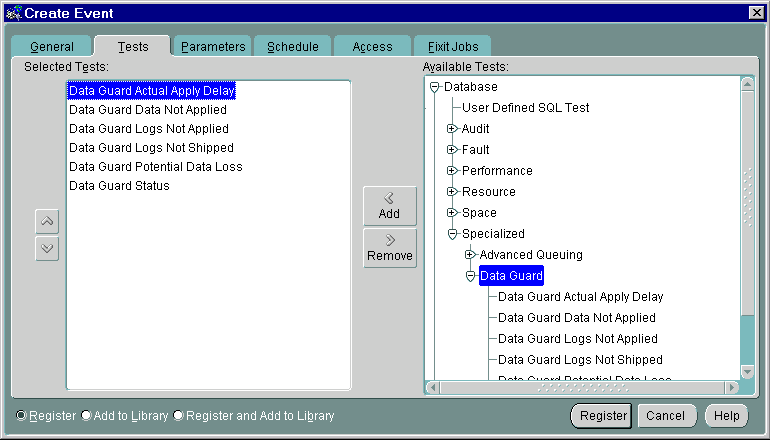
You can create events using predefined event tests that are installed with Data Guard. Table 5-2 describes the six Data Guard event tests.
Using the Enterprise Manager Event System, you can register one or more Data Guard event tests against both the primary and standby databases. You can also set up the Paging /Email Services to notify you through your pager or e-mail if any of the event tests are triggered.
In addition to registering the Data Guard event tests, consider registering the Node UpDown event test against each node where the Oracle Intelligent Agent is running. This event test monitors the node and the Intelligent Agent. Because the UpDown event test is triggered if any problems occur with the node or agent, it can be very beneficial in detecting problems that may prevent other event tests, including Data Guard event tests, from running.
| See Also:
Oracle Enterprise Manager help and documentation for more information about registering event tests and using the Paging/Email Services |
The example in this section describes how to create and register Data Guard event tests and set up for notification through e-mail when an event occurs.
To prepare the Enterprise Manager environment for events, it is essential that you have performed the following prerequisite tasks:
|
Note: These tasks were discussed in detail in Section 5.1. |
If you want to receive event notification by pager or e-mail, invoke the Paging/Email Services to set up the SMTP mail gateway and mail address of the person who will receive the event notification. From the menu bar on the Enterprise Manager Console, invoke the Paging/Email Services by selecting: Configuration > Configure Paging/Email.
| See Also:
The Oracle Enterprise Manager documentation and help for a complete description of the Paging/Email Services |
From the menu bar on the Enterprise Manager Console, select:
Event > Create Event
Complete or modify the fields in the following Create Event property pages:
Database > Specialized > Data Guard
For each event test that you want to create, select the test from the Available Tests view and click Add to move it to the Selected Tests list. In Figure 5-28, all of the Data Guard event tests have been selected.
Text description of the illustration event_tests.gif
When you have completed all of the Create Event property sheets, select Register & Add to Library option on the bottom left side and then click Register & Add to send the event to the selected destinations. This adds the event to the Library and saves the event definitions.
When the event is submitted, the primary and standby database destinations are validated and the Intelligent Agent for each destination processes the event.
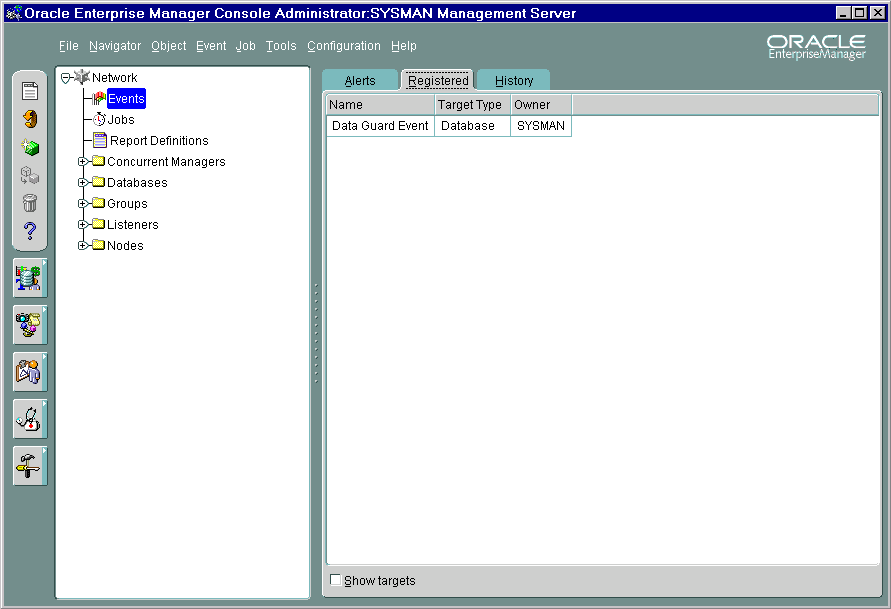
If the registration is successful, the event displays in the Registered page of the Events pane. For example, Figure 5-29 shows that the event named Data Guard Event was registered successfully.
Text description of the illustration registered_event.gif
If an event condition is triggered or a threshold value is exceeded, it shows up in the Alerts pane. If you double-click on an event, the Event Viewer displays a property page showing the status of your events.
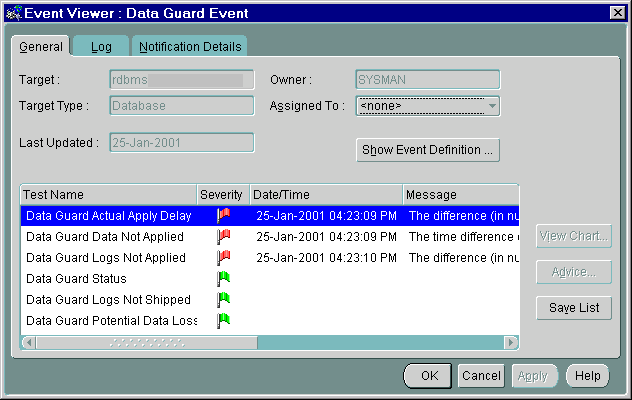
Figure 5-30 shows some Data Guard events that were triggered after log transport services and log apply services stopped between the primary and standby databases.
Text description of the illustration event_viewer_general.gif
In Figure 5-30, notice how the events return a different flag symbol and message, depending on the severity of the event. The severity levels are determined by the parameters you set for the event tests when you created them. See the Oracle Enterprise Manager online help system for more information about the different symbols.
When running the Data Guard event tests, an error might occur for the following reasons:
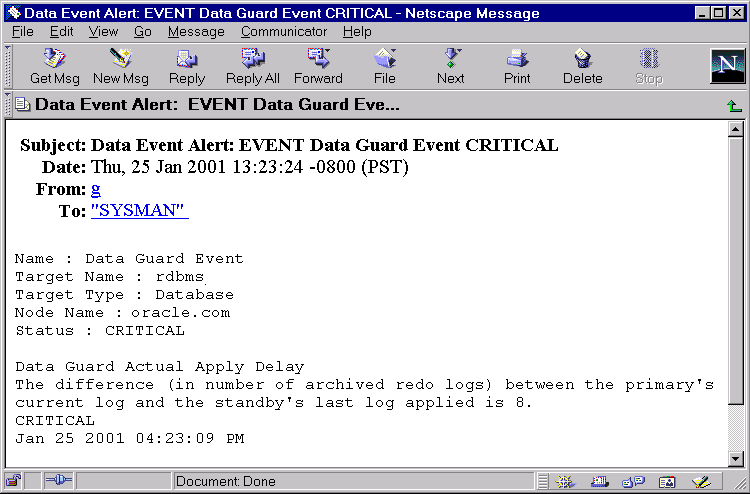
Because the Paging/Email Services was set up, DBAs are also notified by an e-mail message similar to the one shown in Figure 5-31.
Text description of the illustration email_notification.gif
After an event condition is fixed, the event is cleared automatically. You can also clear an event by acknowledging it and moving it to the Events History page.
You can remove a configuration so that it is no longer visible from the navigator in the current Data Guard Manager window, or you can permanently delete the broker configuration.
When you remove a configuration from Data Guard Manager, you remove all broker objects in the configuration from management and monitoring through the GUI. By default, it does not affect the underlying operations of the primary and standby databases, log transport services, or log apply services. Operations such as log shipping and log applying could continue to function. However, these services are no longer manageable through Data Guard Manager.
To remove the broker configuration, you must be connected to the configuration through the primary database. Perform the following steps:
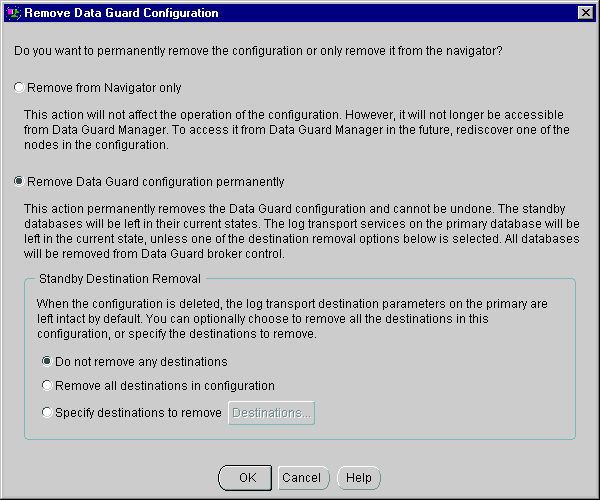
This option removes the configuration from the Data Guard Manager console without actually destroying it. When you choose this option, the actual Data Guard configuration, sites, and resources are still operational and the configuration still exists. You can make the configuration visible in Data Guard Manager once again by using the Enterprise Manager Discovery wizard to rediscover any one of the nodes on which one of the sites is located.
When you choose this option, Data Guard Manager removes (deletes) the selected broker configuration permanently. You must be connected to the broker configuration through the primary database to use this option. When you permanently remove a configuration, the remove operation:
Although the configuration information is not recoverable once you delete a broker configuration permanently, you can easily re-create the configuration with the Create Configuration wizard. See Section 5.12 for more information.
To exit from Data Guard Manager, choose File > Exit.
On both the primary and standby sites, stop the Data Guard monitor by setting the DG_BROKER_START=FALSE parameter using the SQL ALTER SYSTEM statement.
SQL> ALTER SYSTEM SET DG_BROKER_START=FALSE;
System altered.

SQL> SHOW PARAMETER DG_BROKER_START;
NAME         TYPE      VALUE
------------------------------------
dg_broker_start    boolean   FALSE
.
|
Note: After performing this step, you should stop and restart the Intelligent Agent on both nodes to rediscover the nodes and databases. See Oracle Intelligent Agent User's Guide for additional information. |
Use the Create Configuration wizard and choose the Create Existing Standby option to create and enable the broker configuration based on the new primary and standby roles. (Follow the steps in Section 5.2 through Section 5.4.) Because the standby site is already created, you can use the Create Existing Standby method to create the standby database. This method takes only a few minutes to re-create the standby database.
|
 Copyright © 2000, 2002 Oracle Corporation. All Rights Reserved. |
|