|
Oracle® Business Intelligence Discoverer Plus User's Guide
10g Release 2 (10.1.2.1) B13915-04 |
|
 Previous |
 Next |
|
Oracle® Business Intelligence Discoverer Plus User's Guide
10g Release 2 (10.1.2.1) B13915-04 |
|
 Previous |
 Next |
This chapter introduces the main dialogs that you will work with when you use Discoverer Plus Relational, and includes the following topics:
Note: The examples in this chapter use the sample Video Tutorial Workbook that comes with Discoverer. The specific tables, charts, data, and other items you see on your screen depend on the actual data in your database, and the workbook(s) designed by your organization's Discoverer manager.
The work area is where you will do most of your analysis work with Discoverer. The work area displays the current worksheet and tabs for other worksheets in the current workbook. Discoverer's navigation facilities make it easy to find your way around workbooks and worksheets to find the information you want.
You can analyze data in the Discoverer work area in different ways:
using drag and drop (for more information, see "About Discoverer's drag and drop features"
using menus (for more information, see "About Discoverer menus"
using toolbars (for more information, see "About Discoverer toolbars"
using the worksheet wizard (for more information, see "What is the Discoverer Worksheet Wizard?"
When you are working in Discoverer, use the following drag and drop features:
add items to a worksheet by dragging and dropping the item from the Available Items pane onto the worksheet (for more information, see "About dragging and dropping items in the Discoverer work area")
reposition items on a worksheet by dragging and dropping items into position (for more information, see "About repositioning items in the Discoverer work area")
As well as using the menus to add and remove items, you can drag and drop items on a worksheet. The example below shows how to add an item to a worksheet by dragging an item from the Available Items pane onto the worksheet.
To remove a worksheet item, you can also drag and drop the item off the worksheet drag to anywhere outside of the worksheet area (except the Selected Items pane, if displayed).
As well as using the menus to add and remove items, you can reposition a worksheet item by dragging it from one area of the worksheet to another area of the worksheet. In the example below, the Department item is dragged from the left axis to the top axis.
Note: Notice the black bar below the Profit SUM heading, which indicates where the item will be dragged to. You can also drop an item on top of another item to swap the positions of the two items (the target item is marked with a gray bar).
Dragging items to a different axis on a crosstab worksheet is known as pivoting (for more information, see "Pivoting data").
In Discoverer you can use a standard menu and a range of right-click menus to perform tasks.
The standard menu is displayed at the top of the Discoverer work area. The figure below shows the Tools options on the standard menu.
Right-click on any worksheet item heading to display a right-click menu of options that enable you to perform the most common analysis tasks. In the example below, right-clicking on the Profit SUM item displays a list of options that can be used to analyze this item.
In Discoverer you use a range of toolbars to access Discoverer's powerful features quickly and easily.
The Standard toolbar contains icons for the most common menu options (e.g. Save, Print, Refresh, Edit Worksheet, Sort). As you become more familiar with Discoverer, you can use the toolbar instead of the menu bar to choose options.
To display the Standard toolbar, choose View | Toolbars| Standard Toolbar.
Hint: To display the name of a toolbar option, move the cursor over the toolbar option to display a tool tip on that option. For more information, see "About tool tips".
The formatting toolbar enables you to format selected worksheet items.
To display the Formatting toolbar, choose View | Toolbars| Formatting Toolbar.
Hint: To display the name of a toolbar option, move the cursor over the toolbar option to display a tool tip on that option. For more information, see "About tool tips".
The graph toolbar enables you to edit graphs.
To display the Graph toolbar, choose View | Toolbars| Graph Toolbar.
Hint: To display the name of a toolbar option, move the cursor over the toolbar option to display a tool tip on that option. For more information, see "About tool tips".
The Available Items toolbar enables you to edit the worksheet using all items available in the business area.
The Available Items toolbar is displayed above the Available Items pane. To display the Available Items pane, choose View | Available Items Pane.
For more information about options on the Available Items toolbar, see "Available Items pane".
The Selected Items toolbar enables you to edit worksheet items currently on the worksheet.
The Selected Items toolbar is displayed above the Selected Items pane. To display the Selected Items pane choose View | Selected Items Pane.
For more information about options on the Selected Items toolbar, see "Selected items pane".
To help you use Discoverer, tool tips are displayed when you move the cursor over toolbar options. Additional information on toolbar options is also displayed at the bottom of the work area.
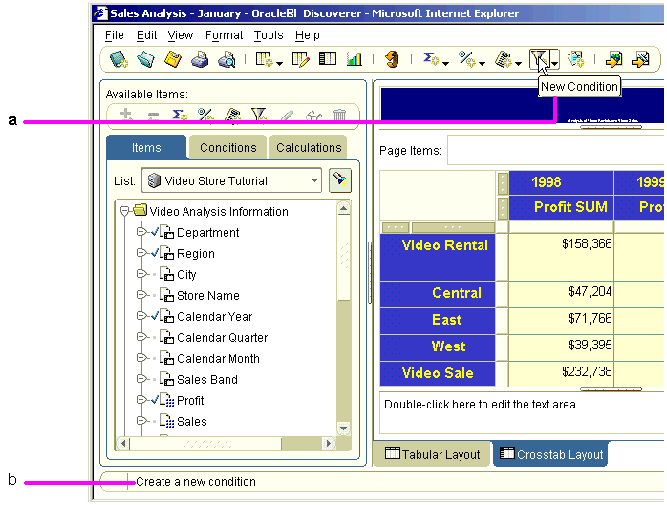
The figure below shows the tool tip for the Conditions toolbar item and also shows where additional information is displayed at the bottom of the Discoverer work area.
Figure 5-10 Discoverer tool tips and status bar

The following table shows the icons displayed in the Discoverer item navigator.
| Icon | Description |
|---|---|
|
|
Aggregations - the mathematical functions to aggregate data. For text items (e.g. Region), the typical aggregations are Count, Max, and Min. For example, you can count the number of Regions items, or find the highest or lowest (where A might be the highest and Z the lowest).
For numeric items, typical aggregations are Sum, Count, Max, Min, Average, and Detail. For example, you can find the Sum or Average of the numeric data. The default aggregation (specified by the Discoverer manager) is displayed in bold. |
|
|
Business area - displays a business area created by the Discoverer manager. To select another business area for the new worksheet, click the drop-down arrow and choose from the list of business areas. A business area contains one or more folders. |
|
|
Calculation - a mathematical expression to produce new data from other items.
Note: Calculations defined by the Discoverer manager appear in folders. User-defined calculations do not appear in folders. |
|
|
Condition - a filter for finding specific data.
Note: Conditions defined by the Discoverer manager appear in folders. User-defined conditions do not appear in folders. |
|
|
Folder - contains the items that you can include in your worksheets. Click the plus (+) and minus (-) symbol next to the folder to open and close the folder. |
|
|
Item - corresponds to a column on a table or a level on a crosstab axis. Axis items remain constant and have relatively few unique values (e.g. the names of departments in your organization, the names of your Sales Regions). The values of an axis item are shown as a list of values (LOV). |
|
|
Item Value - an item in a list of values (LOV). |
|
|
Numeric Item - represents numeric data. The values of numeric items can change as you analyze the data (e.g. summing profits will produce different results for cities than for regions). Numeric items behave as axis items on table worksheets and correspond to the data in the body of a crosstab. |
|
|
Percentage - a percentage that Discoverer calculates to summarize values in a numeric worksheet item. |

|
Tick symbol (or check mark) - worksheet items marked with a tick symbol are currently displayed on the current worksheet. |
|
|
Total - a total that Discoverer calculates to summarize values in a numeric worksheet item. |
Note: Items that are grayed out are not available to the worksheet.
Axis items are items that appear in the workbook window in:
the page axis
the top axis
the left axis
Typically, axis items have a relatively few discrete values. You use axis items to identify particular data values.
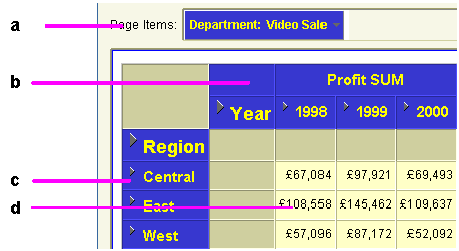
For example, if a crosstab worksheet shows sales figures, it might include Year as the top axis and Region as the left axis. You can then use the axis items to see the sales of a particular region in a particular year. In the figure below, Department item is on the page axis, Year is on the top axis, and Region is on the left axis.
Figure 5-11 A crosstab worksheet showing page axis, left axis, and top axis

Data points on a worksheet are the data in the body of a worksheet. Data points are the data that you want to use for analysis purposes. Typically:
On a table worksheet, data points contain text and numeric information (e.g. customer mailing lists, product part number lists).
On a crosstab worksheet, data points contain numeric values calculated at the intersection point of the top axis and left axis (e.g. monthly profits, sales amounts by product).
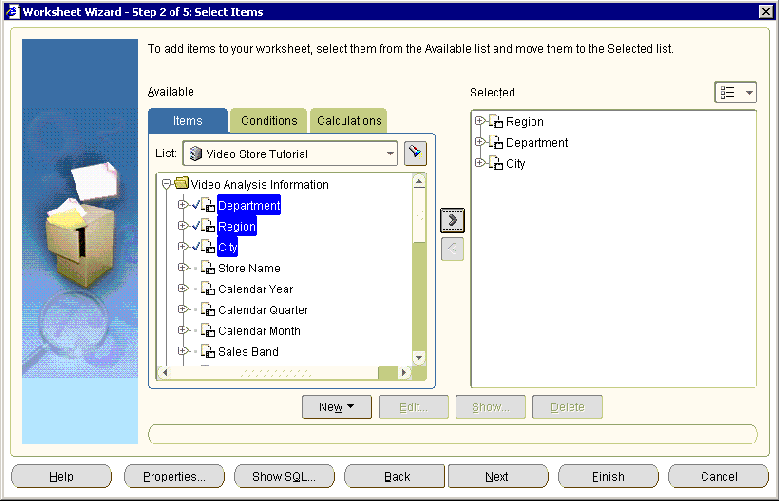
Whenever you create a new worksheet, the Worksheet Wizard walks you through the steps necessary to get data from the database and arrange the worksheet items. The figure below shows the Select Items page of the Worksheet Wizard. In the Available list, simply select the folder or item that you want to add to the worksheet then drag it to the Selected list.
Figure 5-12 The item navigator page of the Discoverer Worksheet Wizard
