|
Oracle® Application Server Performance Guide
10g Release 2 (10.1.2) B14001-02 |
|
 Previous |
 Next |
|
Oracle® Application Server Performance Guide
10g Release 2 (10.1.2) B14001-02 |
|
 Previous |
 Next |
This chapter discusses how to monitor the performance of Oracle Application Server Containers for J2EE (OC4J). Obtaining performance data can assist you in tuning Oracle Application Server or in tuning and debugging applications with performance problems.
This chapter contains the following topics:
Using Application Server Control Console, you can view information on the performance characteristics of OC4J instances, J2EE applications, and Oracle Application Server components running under OC4J. This section covers the following:
Monitoring OC4J Instances With Application Server Control Console
Monitoring J2EE Applications with Application Server Control Console
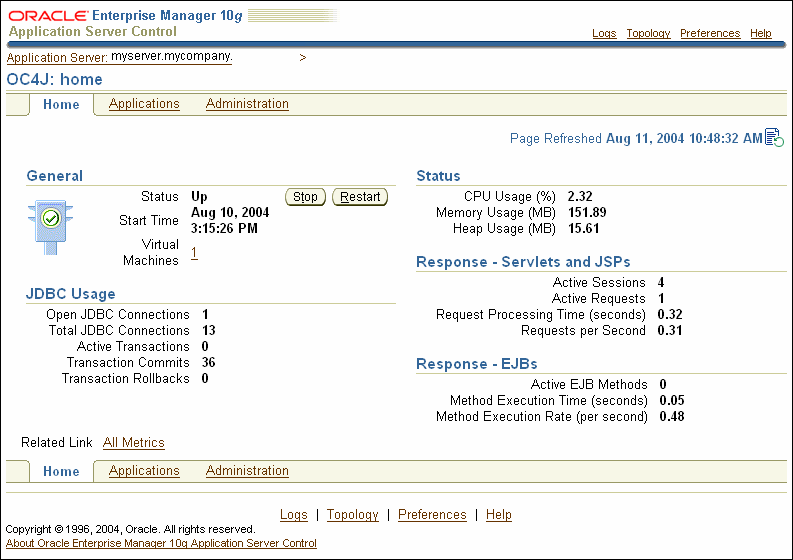
Before analyzing OC4J performance, make sure that your OC4J instance is running. Figure 4-1 shows Application Server Control Console with the OC4J instance homepage. This page shows the status for a selected OC4J instance (the Up under the heading General indicates the OC4J instance is running).
While Application Server Control Console provides standalone management for an Application Server and its components, if you want to centrally manage multiple Application Servers through one tool rather than through several Application Server Control Consoles use Oracle Enterprise Manager 10g Grid Control Console.
Figure 4-1 Application Server Control Console OC4J Instance Page

|
Note: Application Server Control Console does not provide information on OC4J JMS. Use the built-in performance metrics to obtain information on OC4J JMS. |
The Application Server Control Console OC4J General information provides information on up and down status for the OC4J instance, its start time, and information on the virtual machine where the OC4J instance is running. This area also presents buttons that allow you to stop or restart the OC4J instance.
The Application Server Control Console OC4J JDBC Usage information shows the number of open JDBC connections, the total number of JDBC connections, the number of active transactions, and the total number of transaction commits and transaction rollbacks for the OC4J instance.
The Application Server Control Console OC4J Status information shows the CPU usage, memory usage, and heap usage for the OC4J instance.
The Application Server Control Console OC4J Response information for Servlets and JSPs shows the number of active sessions, the active requests, the average request processing time, and the requests processed per second for active requests.The value shown for requests processed per second is a rate that is calculated using the requests processed over the previous 5 minutes.
The Application Server Control Console OC4J Response information for EJBs shows the number of active EJB methods and the EJB method execution rate. The EJB method execution rate provides the number of methods executed per second over the previous 5 minutes.
|
Note: Application Server Control Console automatically collects a subset of metrics approximately every five minutes. The rates shown in the Application Server Control Console display are computed over the period that spans from the most recent collection to the refresh of the Application Server Control Console display. |
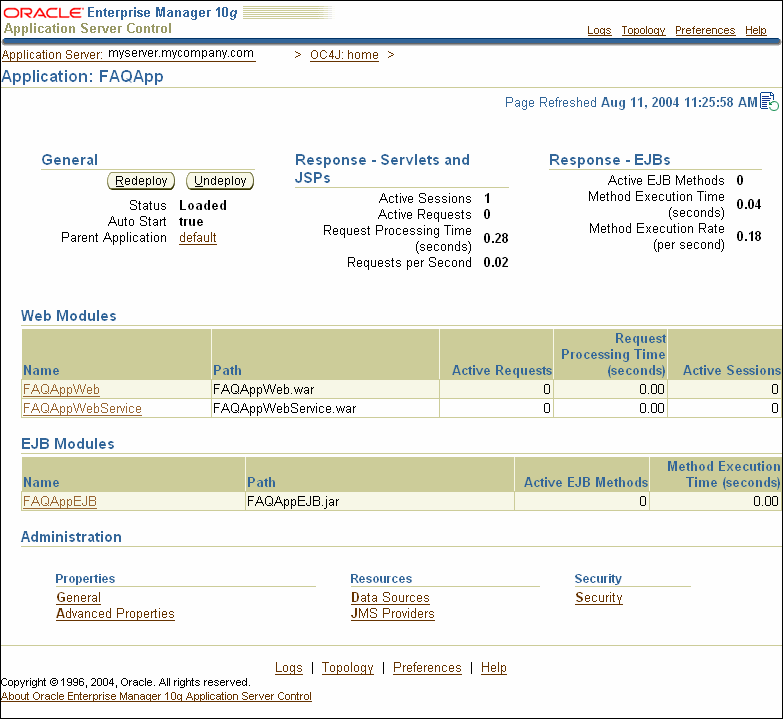
After you know that the OC4J instances that contain your J2EE applications are running, check the status for your applications. If your J2EE applications are not loaded, then deploy them and then try accessing the applications to make sure that they work properly. Figure 4-2 shows an Application Server Control Console page for the FAQApp sample application.
Figure 4-2 Application Server Control Console J2EE Application Metrics

Figure 4-2 shows the available Application Server Control Console J2EE application level performance data collected in the following categories:
The Application Server Control Console J2EE application General information provides an indication of whether the application is loaded or not in the status field, and shows if the Auto Start status is true or false. The Parent Application field provides a link to the application parent. This area also presents buttons that allow you to Redeploy or Undeploy the application.
The Application Server Control Console J2EE application Response information for Servlets and JSPs shows the number of active sessions, the active requests, the average request processing time, and the requests processed per second, over the previous 5 minutes, for active requests for the application. For more detail on this information or to drill down to specific Servlets and JSPs, use the links in the Web Modules table.
The Application Server Control Console J2EE application Response information for EJBs shows the number of active EJB methods and the EJB method execution rate over the previous 5 minutes.
For more detail on this information or to drill down to specific Servlets and JSPs, use the links in the EJB Modules table.
|
Note: Application Server Control Console automatically collects a subset of metrics approximately every five minutes. The rates shown in the Application Server Control Console display are computed over the period that spans from the most recent collection to the refresh of the Application Server Control Console display. |
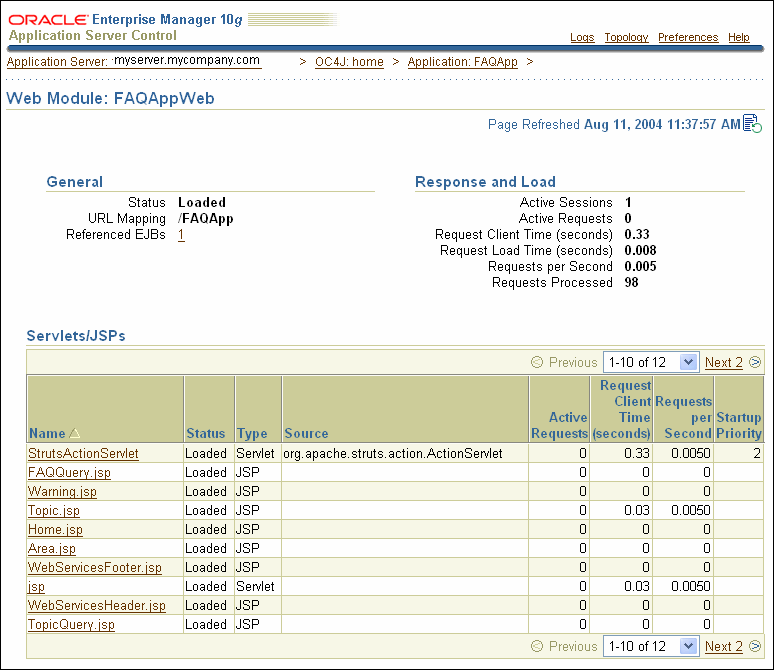
The Web Modules table allows you to obtain more detailed information for Servlets and JSPs within a J2EE application.
Figure 4-3 shows the details for the FAQApp application's Web Module, including General information, Response and Load information, and a table showing data values for each of the Servlets and JSPs that are part of the application.
Figure 4-3 Application Server Control Console J2EE Application Web Module Metrics

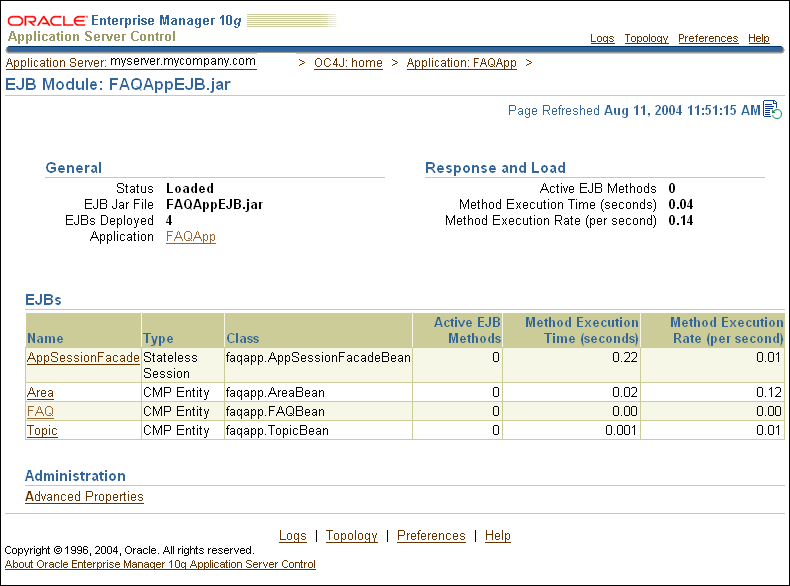
The EJB Modules tables allow you to obtain more detailed information on EJB modules and EJBs within the J2EE application.
Figure 4-4 shows a sample FAQApp EJB Module page.
Figure 4-4 Application Server Control Console EJB Module Page

You can use the Oracle Application Server built-in performance metrics to analyze OC4J and J2EE application performance. Before you attempt to monitor OC4J performance, verify that the OC4J instance named home that is installed by default with Oracle Application Server is running by accessing the following URL:
http://myhost:port/j2ee/
The value for myhost should be the host where OC4J is installed. The port must be the port number on which Oracle HTTP Server listens, as configured in the Oracle HTTP Server httpd.conf file.
Be sure to include the trailing slash (/) in the URL, otherwise the page cannot be found on the system. If your default Web site has been mapped to something other than the default location /j2ee/, then you should access the location configured on your system.
If the default OC4J instance is running, then accessing this URL displays the Welcome page for Oracle Application Server Containers for J2EE (OC4J). From the OC4J Welcome page you can access the samples for JSPs and servlets. If you do not have active J2EE applications that you want to monitor, you can test the monitoring facilities using your browser to request sample servlet-generated or JSP-generated Web pages.
For example, use the following URLs:
http://myhost:myport/j2ee/servlet/SnoopServlet
http://myhost:myport/j2ee/servlet/HelloWorldServlet
Then, use AggreSpy or dmstool to see the values of metrics for the built-in performance metrics.
For example, to use AggreSpy, enter the following URL in your Web browser:
http://myhost:myport/dms0/AggreSpy
The resulting display from the AggreSpy provides a list of metric tables in the left-hand pane that can be selected to display performance metrics for OC4J and Oracle Application Server components. Alternatively, you can use dmstool on the command line or in scripts that you write to display performance metrics.
Note the following when you are monitoring OC4J built-in metrics:
Oracle recommends that you monitor usage counts and service times for each of your application's Servlets, JSPs, EJBs, JMS applications, and other components, checking collected metrics against your design and deployment assumptions. You should check these assumptions with single browser client scenarios, with simulated multiuser workloads, and in production.
When troubleshooting performance degradations, you can use either the AggreSpy metric tables or the dmstool collected metrics to find the Servlets, JSPs, EJBs, EJB methods, and JMS topics or queues that are used most often. In many cases, heavily-used application components are responsible for system resource utilization, so focus your troubleshooting effort on the most heavily-used components first.
Select the JVM metric table to analyze overall JVM performance for the applications in an OC4J instance. The JVM metric table provides useful information about threads and heap memory allocation. You should check these values to make sure that JVM resources are utilized within expected ranges.