|
Oracle® Business Intelligence Discoverer Desktop User's Guide
10g Release 2 (10.1.2.1) for Windows B13917-03 |
|
 Previous |
 Next |
|
Oracle® Business Intelligence Discoverer Desktop User's Guide
10g Release 2 (10.1.2.1) for Windows B13917-03 |
|
 Previous |
 Next |
This chapter explains how to create reports with Discoverer Desktop.
Topics in this chapter include:
Tables and crosstabs are displayed in a format that easily lends itself to reporting of results. Additional options, such as adding headers and footers, page numbers, and the date, help you prepare the report for printing.
Here is an example of a table and a printed version of it as a report.
Use the Page Setup dialog box to add print options to a report.
The Page Setup dialog box appears. The tabs across the top of the dialog box list the various types of options you can select to design the report.
Print What—Specifies the sheet(s) that you want to print.
Selected Sheet—Prints the current sheet displayed in the workbook.
All sheets—Prints all of the sheets in the workbook.
Graph— Prints the graph of a worksheet. This option is available only if the worksheet's graph is displayed. Choose Graph | Show to display a graph.
All Page/Detail Combinations—Prints all pages of a worksheet with all combinations of the page items and data points.
Note: Be careful when selecting this option if your worksheet includes many pages and data items. You may print more than you intend.
Page Order—Specifies how to print worksheets that don't fit on a single page, such as a table with many columns.
Down, then Across—Prints the left-hand section of the table or crosstab from top to bottom on successive pages, then prints the right-hand section from top to bottom on successive pages.
Across, then Down—Prints the top section of the table or crosstab from left to right on successive pages, then prints the bottom section from left to right on successive pages.
Orientation—Prints in either Portrait or Landscape mode. Tables and crosstabs often are better suited to the Landscape mode.
Scale—This option is available if your printer uses a Postscript driver for printing. Scaling prints the table or crosstab at the scale factor in the box. Click the up and down arrows to increase or decrease the number. Scaling is particularly useful when you're printing tables and crosstabs that are too big to fit on a single page. Scaling ÒshrinksÓ the table or crosstab so more rows and columns fit on the page. (You can also configure scaling from the File ¦ Print ¦Properties, Advanced Tab dialog, if a postscript printer is being used.)
Click the Header tab to see the options for the report's header. The options for footers are the same.
Figure 6-3 Page Setup for Header and Footer
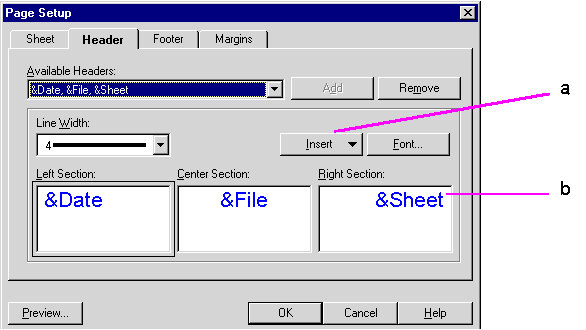
Available Headers—Lists headers you have already created. Click the drop-down arrow to see the list. Select the one you want on your report. The names are derived from the text typed into the boxes for the Left, Center, and Right sections.
To create a new header (or footer), choose <none> from the drop-down list. Enter the header text in the three boxes for the Left, Center, and Right sections. Click the Add button. That header is added to the drop-down list. To remove a header from the list, select it and click the Remove button.
Line Width—Sets the width of a line that separates the header from the body of the report. Choose No Line if you don't want a separating line on the report.
Left, Center, Right Sections—Displays the text of the header selected in the Available Header list above. To edit a header, click in a box and type the new text. By default, the Left Section's text is left-justified, the Center's text is centered, and the Right Section's text is right-justified.
Insert—Lists information that you can add to the header. Click in the text where you want the inserted information to appear, then choose from the list to add a text code to the header or footer. The text code is a ÒplaceholderÓ for variable information in the report.
In the following figure, &Date is the placeholder for the current date when the report is printed. Because the inserted information is in the Left Section box, the current date appears at the left side of the page on the printed report.
You can mix typed text with inserted text. Here are some examples:
Font—Displays the Font dialog box. Click anywhere in the section where you want to change the font. Click the Font button then select the options for the text. Click OK. All the text for the selected section receives the new font.
Click the Margin tab to see the options for the report's margins.
Figure 6-5 Page Margins Setup for Reports
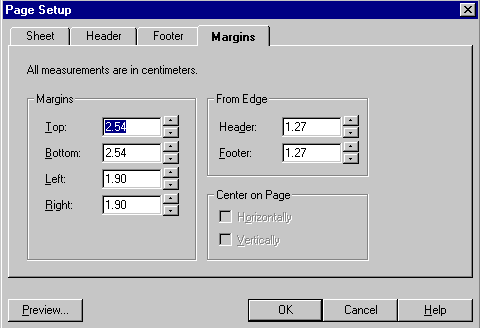
Margins—Sets the margins on the page. Click the up and down arrows next to a margin setting to increase or decrease it.
From Edge—Sets the distance of the header and footer from the edge of the paper. Click the up and down arrow to increase or decrease the distance. Note that the distance from the edge of the page cannot be greater than the margin; otherwise, the header or footer would print in the table or crosstab. For example, if the bottom margin is 1.00, the footer cannot be 1.25.
To see the results of the Page Setup options, click the Preview button. A preview of the report appears on the screen. See the next section for details.
To preview a report, click the Preview button on the Page Setup dialog box or choose File | Print Preview. The Print Preview window appears and shows a representation of the printed report.
The buttons across the top of the Print Preview window are for selecting preview options:
Print—Prints the report.
Next Page—Displays the next page of the report. As you move through the pages, the page number of the report appears at the bottom left corner of the window.
Prev Page—Displays the previous page of the report.
Two Page/One Page—Displays two report pages side-by-side. When two report pages are displayed the button changes to read One Page. Click the One Page button to display a single page. This option is not available when the page is zoomed in, because two pages cannot fit side-by-side in the window.
Zoom In—Enlarges the page so you can preview it in more detail. You can zoom in up to three times. The pointer becomes a magnifying glass. You can also zoom in the image by putting the pointer anywhere on the page and clicking.
Zoom Out—Reduces an enlarged (zoomed in) image.
You can send worksheets, graphs, and selections of a table or crosstab as part of an e-mail message. This feature is available for most e-mail applications, however, if it does not appear on the menu, your e-mail application does not support the feature.
To send a report with an e-mail message:
Display the worksheet that you want to send as a report.
The Prepare Mail dialog box appears.
Current Sheet—Selects the current worksheet displayed in the workbook window to send with the e-mail.
All Sheets—Selects all the sheets in the workbook to send with the e-mail.
Selection—Sends a portion of the worksheet if you have a portion of the worksheet selected.
Graph—Sends a graph if a graph is displayed. The graph is sent as an attachment to the e-mail.
Send this as—These options are available for the appropriate types of reports. For example, graphs can only be sent as attachments, not as message text.
An Attachment—The selected worksheet or graph is attached to your e-mail message.
Message Text—The current worksheet or selected portion of a worksheet is placed in the body of the e-mail message. This option is not available for graphs and the All Sheets option.
Note: To send the workbook in a Discoverer format, select All Sheets and send the workbook as An Attachment.
What format do you want—Click the drop-down arrow and choose a format appropriate for your e-mail application. The options on the list correspond to the type of worksheet you want to send.
For example, the only format for a graph is Windows Meta File (WMF), which is the proper format for sending a graph. Therefore, the drop-down menu is not available for graphs. Similarly, to send a selected portion of a worksheet as attachment text, the drop-down menu provides the appropriate options.
The following figure shows some available options for attachments:
Figure 6-8 E-Mail Attachment Format Options
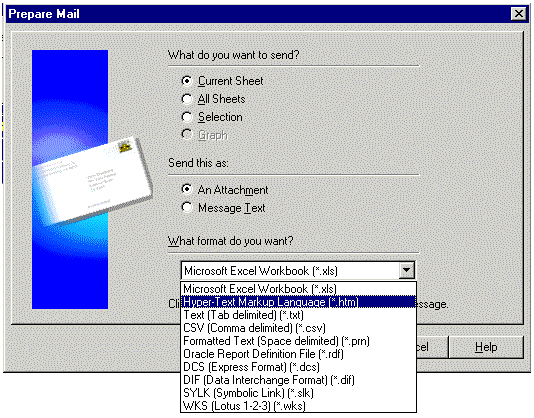
If you select Oracle Report Definition File (*.rdf), a Next button appears at the bottom of the dialog box so you can select additional formatting for the report. See Section 6.3.1, "Exporting to Oracle Reports" for details.
Click the Send button.
Your e-mail application starts. Based on your selections on the Prepare Mail dialog box, the worksheet or workbook is either an attachment or the message text of the e-mail message.
You can export tables and crosstabs in a variety of formats to open them in other applications. For example, you can export a table to a Microsoft Excel workbook or a Lotus 1-2-3 spreadsheet and then use Excel or Lotus 1-2-3 to open the table.
To export to other applications:
Display the worksheet that you want to export.
The Export dialog box appears. See the previous section for a description of the export options.
Choose an export format from the drop-down menu.
Choose a directory to save the export file.You can also type the directory path in the box. Click the Browse button to see other directories.
Enter a name and directory path for the report.
For example, in the dialog box shown above, the name and directory path is C:\Video Stores Analysis.xls.
Click Finish.
The report is saved in the new format in the directory you specified.
If your computer includes the Oracle Reports application, you can export tables and crosstabs from Discoverer Desktop as an Oracle Report. Having this capability means that you can apply the extensive formatting features of Oracle Reports to your Discoverer Desktop reports.
To export to Oracle Reports:
Display the worksheet that you want to export to Oracle Reports.
The Export dialog box appears.
Figure 6-10 Export to Oracle Reports, Step 1
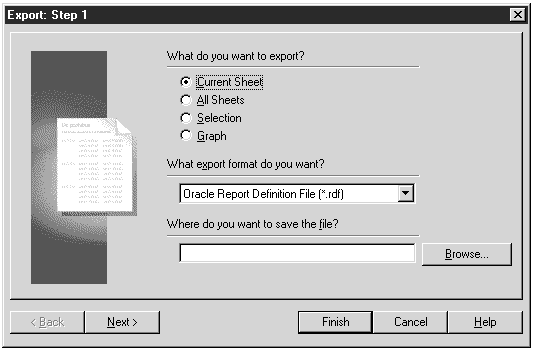
Choose Oracle Report Definition File (*.rdf) as the export format.
Choose a directory to save the export file. You can also type the directory path in the box. Click the Browse button to see other directories.
Enter a name for the report in the directory path.
Click Next.
The dialog box for choosing the report's template appears.
Figure 6-11 Export to Oracle Reports, Step 2
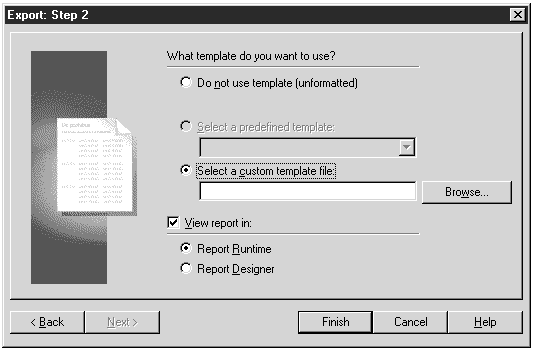
The dialog box has options for selecting a report template that you created earlier in Oracle Reports.
Do not use template (unformatted)—exports the report with no formatting, fonts, or colors.
Select a predefined template—select a template for the report from the drop-down menu; the list shows templates already predefined in Oracle Reports.
Select a custom template file—if you created a custom template in Oracle Reports earlier, it will be listed here; select a template from the drop-down menu.
View Report in—select this option if you want to see what the report looks like in the Oracle Reports format.
Report Runtime—view the report in the Oracle Reports runtime.
Report Designer—view the report in the Oracle Reports Builder application; you can then edit the report using Designer's features.
Click Finish.
The template is applied to the report, and the report is saved in the directory that you specified earlier. You can open the report in Oracle Reports, or any other application that supports Oracle Reports.
The Excel tool on the tool bar helps you export Discoverer Desktop tables and crosstabs quickly to Microsoft Excel.
To export to Excel:
Display the worksheet you want to see in Microsoft Excel.
Click the Excel tool on the tool bar.
The worksheet is saved in .xls format, and Microsoft Excel opens to display the worksheet.
Scheduled reports are workbooks set to run at a specified time. For example, you may want to run a worksheet at the end of each month that calculates monthly profits from monthly sales figures, or run a report every two weeks based on a worksheet that produces a biweekly cash flow analysis.
Often, worksheets that you want to use as scheduled reports are designed specifically for that purpose, rather than being a worksheet for your day-to-day analysis. For example, the worksheet may include special calculations or conditions that produce the results you want for the scheduled report on a periodic basis only.
You can select all or some of the worksheets in a workbook to run as a scheduled report. Typically you schedule reports if:
The report will take a long time to run; scheduling a report to run at night or on the weekend avoids overburdening the server during normal working hours.
You run a report at regular intervals, such as weekly report of sales figures or a monthly cash flow analysis.
Because a scheduled report runs on the server, you do not need to leave your computer running overnight (or whenever you schedule the report to run). The results of running the scheduled report are saved on the server as well and, therefore, are available when you log on to the server and start Discoverer Desktop.
To schedule a report:
Open the workbook that contains the worksheets that you want to schedule to run as reports.
The Schedule Workbook dialog box appears.
Figure 6-14 Schedule Workbook Dialog Box, Step 1
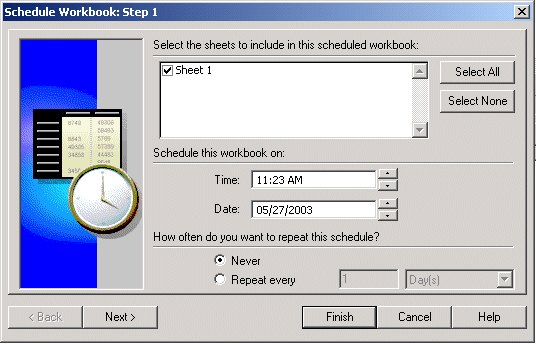
Select in the check box next to a worksheet title to include that worksheet as part of the scheduled report.
Click Select All to include all of the workbook's worksheets in the report.
Click Select None to clear each check box.
Enter the time and date to run the report.
To change the time and date, click on the numbers you want to change, then either type the new time or date, or click the up and down arrows. For example, to change 08:00 PM to 12:01 AM, click on the 08 and either type 12 or click the up arrow until 08 becomes 12. Then click on the 00 and type 01 or click the up arrow once. Then click on PM and click either arrow; PM changes to AM.
Select one of the options for how often you want to repeat the schedule:
Never—runs the scheduled report once and only once.
Repeat every—runs the report on a periodic basis; enter a number and select a time interval from the drop-down menu. For example, to run a monthly report, enter 1 Month in the selections.
Click Next.
Figure 6-15 Schedule Workbook Dialog Box, Step 2
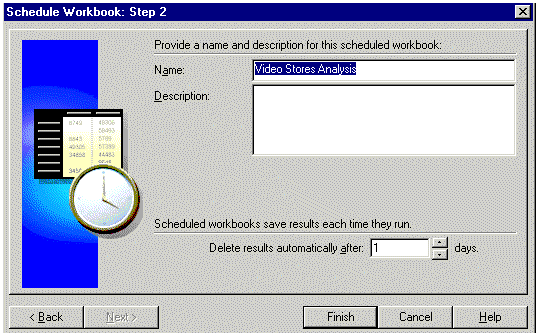
(Optional) Enter a description for the scheduled report. This is particularly helpful if you've created several scheduled reports. The description appears on the Scheduling Manager dialog box.
Enter a length of time to keep the results of the scheduled report stored on the server. After that period of time the results are automatically deleted from the server. If you've saved the results as a worksheet on your local computer, that worksheet remains intact.
Click Finish.
The workbook and its worksheets are now scheduled and run based on the options you selected in the Schedule Workbook dialog box.
A scheduled report produces a worksheet or set of worksheets with the results derived from running the report. You can see those results when first starting Discoverer Desktop, or while working in a workbook.
To see a report while you're working with Discoverer Desktop, use the Scheduling Manager as described in the next section.
If you run a scheduled report overnight (or over the weekend) and want to see the results first thing the next morning, use the following procedure.
To see the results of a scheduled report when starting Discoverer Desktop:
Start Discoverer Desktop and log on in the normal manner.
The window appears for selecting what to open.
Click the button, Open an existing workbook.
Figure 6-16 See a Scheduled Report Results
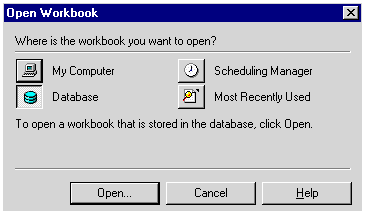
Click the Scheduling Manager button.
The Open Scheduled Workbook dialog box opens. It lists the completed reports.
Figure 6-17 Open Scheduled Workbook Dialog Box
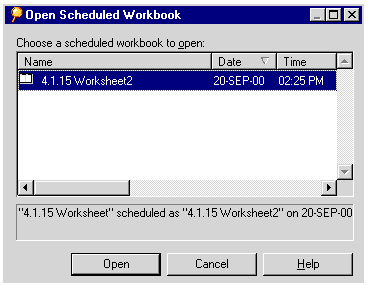
Click Open.
The workbook opens and displays the worksheets generated by the scheduled report.
|
Note: The worksheets produced by running the scheduled report contain data derived specifically for that report. You can now work with the worksheet in the normal manner, but if you change any of its data, a message reminds you that the data on the worksheet is no longer the specific data derived from the report. |
When connected as an Oracle Applications User, the following rules apply:
If you connect as a particular User and Responsibility and schedule a Workbook, the Scheduled Workbook is specific to that User and Responsibility.
If you connect as a particular User but a different Responsibility from the one used to schedule a Workbook, the Scheduled Workbook may contain different results from the original Scheduled Workbook that was created.
With the Scheduling Manager you can see the results of a scheduled report, schedule a new report, reschedule a report, or edit a report's schedule.
To run the Scheduling Manager, choose File | Manage Workbooks | Scheduling Manager. The Scheduling Manager dialog box appears.
The Scheduling Manager shows scheduled reports and completed reports. The clock icon indicates a scheduled report set to run at a specified time. The icon without a clock indicates a completed report. Other information in this dialog box includes the following:
Name—the names of the scheduled reports or completed reports. You can open completed reports. You cannot open scheduled reports, though you can edit the schedule configuration if required.
Status—status types include scheduled, completed, in progress, out of date (expired), deleted by the database administrator, unable to be scheduled, had an error during the report run, and so on.
Date and Time—either the date and time a scheduled report is set to run or the date and time a completed report was run.
Run time—the length of time needed by the server to complete a scheduled report.
To schedule a new report from the Scheduling Manager dialog box:
The Schedule Workbook dialog box appears.
Click either My Computer or Database to identify the location of the workbook that contains the worksheets for the scheduled report.
Click Schedule. The Open dialog box appears.
Schedule the reports as described earlier.
To see the results of a scheduled report:
Select the completed report in the list.
Click Open.
Note: The Open button is only available when you select a completed report.
The workbook containing the completed report opens and displays the worksheets that you designated as a scheduled report.
Select the completed report in the list.
Click Delete.
Note: The Delete button is only available when you select a completed report. It changes to Unscheduled when you select a scheduled report in the list.
To unschedule a scheduled report:
Select the scheduled report.
Note: The Unschedule button is only available when you select a scheduled report. It changes to Delete when you select a completed report in the list.
Unscheduling a report deletes it from the list.
To edit the settings of a scheduled report:
Select the scheduled report in the list.
Click the Edit button.
The Schedule Workbook dialog box appears. The Schedule tab is selected.
Figure 6-20 Schedule Workbook Dialog Box for Editing
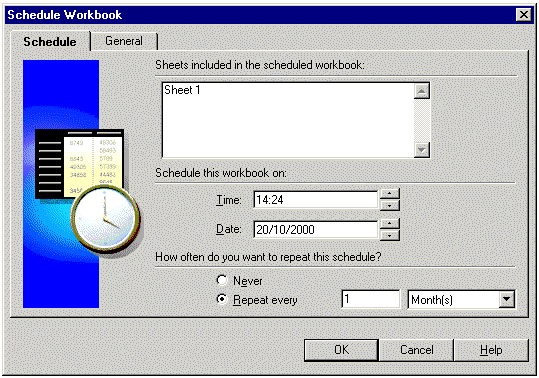
This dialog box is almost the same as the dialog box you used to create the scheduled report except you cannot add or delete the sheets in the scheduled report from this dialog box. To do that you need to create a new scheduled report by choosing File | Schedule.
Make the scheduling changes that you want.
Click the General tab.
Make the changes on that dialog box that you want.
Click OK.
The schedule in the Scheduling Manager dialog box updates to include your changes. Now the scheduled reports will run based on the updated settings.
Sharing a workbook grants other people access to it to view, analyze, and print the data. You can share workbooks with other people by setting up sharing two ways:
Assign a group of people who can share one of your workbooks.
Assign one or more workbooks that one other person can share with you.
Sharing workbooks lets others use and analyze the same data. For example, you may want everyone in the accounting department to share a workbook that includes accounts payable and accounts receivable information. Similarly, you may want a project manager to have access to all the workbooks created for the project.
To share workbooks, choose File | Manage Workbooks | Sharing. The Share Workbooks dialog box appears. The two tabs at the top of the dialog box are for assigning workbooks to users or users to workbooks.
Workbook -> User—click this tab to share one workbook with several other people.
User -> Workbook—click this tab to share several workbooks with one other person.
To share a workbook with several other people:
Choose the name of the workbook that you want to share from the drop-down list.
In the list of Available Users, click the name of a person with whom you want to share the workbook.
Click Add. The person's name appears in the Shared column.
The list of names in the Shared column are the people who can have access to the workbook.
Repeat for all the other people with whom you want to share the workbook.
Click OK.
To share several workbooks with one other people:
Choose the name of the person with whom you want to share the workbook from the drop-down list.
In the list of Available Workbooks, click the name of a workbook that you want to share the other person.
Click Add. The workbook's name appears in the Shared column.
The list of names in the Shared column are the workbooks the other person can share with you.
Repeat for all the other workbooks that you want to share the other person.