|
Oracle® Application Server Portal Configuration Guide
10g Release 2 (10.1.4) B19305-03 |
|
 Previous |
 Next |
|
Oracle® Application Server Portal Configuration Guide
10g Release 2 (10.1.4) B19305-03 |
|
 Previous |
 Next |
This chapter provides information about the monitoring and administration tools that are available, and how to use them to successfully monitor and administer OracleAS Portal.
You can monitor and administer OracleAS Portal through the Oracle Enterprise Manager 10g Grid Control Console, or the Oracle Enterprise Manager 10g Application Server Control Console. Additionally, you can view OracleAS Portal Analytics to monitor OracleAS Portal performance and analyze OracleAS Portal access characteristics.
|
See Also: For additional OracleAS Portal monitoring and administration information, see the OracleAS Portal Administration page on the Oracle Technology Network (OTN), athttp://www.oracle.com/technology/products/ias/portal/administration_10g1014.html.
|
This chapter contains the following sections:
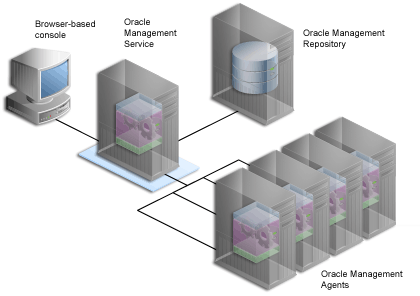
The Oracle Enterprise Manager 10g Grid Control Console is a full enterprise management framework consisting of the Oracle Management Service, Oracle Management Agent, and Oracle Management Repository. In the Grid Control Console, you can:
Manage targets in your environment
Monitor historical trends
Configure alerts
View diagnostics
Monitor application performance
Manage enterprise configuration
|
Note: For more information, see the Oracle Enterprise Manager Grid Control Installation and Basic Configuration guide. |
Oracle Enterprise Manager 10g uses a Web-based architecture that is robust, reliable, globally scalable, and easy to deploy and operate within today's Internet-enabled environments. This architecture (shown in Figure 7-1) uses four integrated software components, three of which (Oracle Management Service, Oracle Management Repository, and Oracle Management Agent) run behind the scenes, gathering, organizing, and routing management data. The Browser-based console provides a Web-based user interface so you can manage the information from a standard Web browser.
Figure 7-1 Overview of Oracle Enterprise Manager 10g Grid Control Console Components
The Oracle Enterprise Manager 10g Grid Control Console ships with Oracle Application Server, but must be installed separately. In the case of OracleAS Portal, the Grid Control Console can be used for monitoring, and tracking historical trends, but not for configuration.
You can access the Grid Control Console by navigating to the following URL: http://<hostname.domain>:<port>/em/. For example, http://myhost.mycompany.com:7777/em/. You can find the URL for your Grid Control Console in setupinfo.txt. This text file is saved to the following location after you install the Oracle Application Server:
On UNIX: ORACLE_HOME/install/setupinfo.txt
On Windows: ORACLE_HOME\install\setupinfo.txt
You must then log in using a valid Grid Control Console user name and password combination with privileges to access the OracleAS Portal targets you intend to monitor.
After logging on successfully, the Oracle Enterprise Manager 10g Grid Control Console home page is displayed.
To drill down to the application server level, click the Targets tab, and then the Application Servers subtab. Select the application server that you want to monitor from the list of available application servers. The home page for the selected application server is then displayed.
From the application server home page, you can click any of the components listed to get detailed information. For example, if you click the Portal component, if listed, the OracleAS Portal target page is displayed as shown in Figure 7-2.
Figure 7-2 Grid Control Console - Portal Target Page
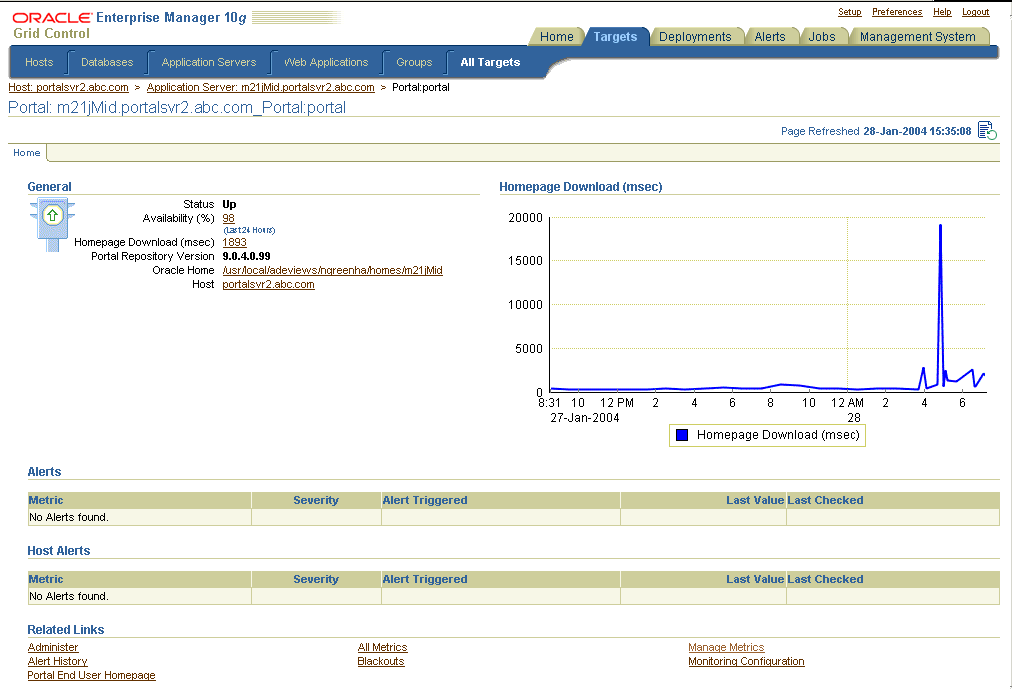
On the Portal target page, in addition to availability information, you can monitor the average home page download time on a chart.
The Grid Control Console helps you in:
In the Grid Control Console, you can look at various OracleAS Portal metrics collected over a specific time period. The range of metrics which are collected are configured (by default) when the Management Agent is installed.
Figure 7-3 shows a list of the kinds of OracleAS Portal metrics you can monitor.
Figure 7-3 Grid Control Console - OracleAS Portal Metrics
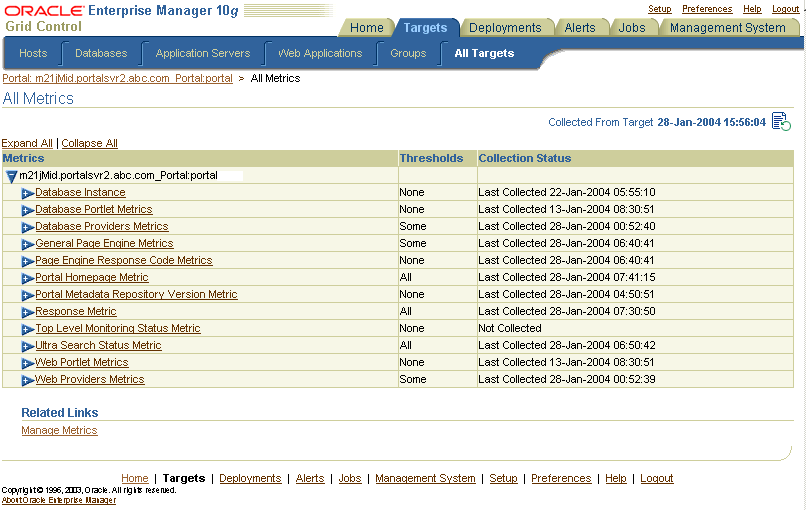
You can use the OracleAS Portal metrics to monitor historical trends. For example, if you want to see how your site has performed over the previous 31 days, follow these steps:
Navigate to the Grid Control Console home page.
Click the Targets tab, and then the Application Servers tab.
Choose the application server of interest.
From the Components table, select the Portal target.
Click the All Metrics link.
Expand the Portal Homepage Metric node.
Click the Homepage Download (msec) metric.
A table lists all the collected data for this metric over the last 24 hours, by default. Figure 7-4 shows an example of the information displayed.
Figure 7-4 Grid Control Console - OracleAS Portal Metric Information

To change the duration to 31 days, select Last 31 days from the View Data drop-down list (top right hand corner).
You can compare the details of an OracleAS Portal metric (the currently selected metric), with the details of the same metric on a different OracleAS Portal target.
For example, you can compare the Homepage Download (ms) metric on portal1 with the Homepage Download (ms) metric on portal2 and portal3. The comparisons are plotted on a Metric Value History chart.
To compare metrics:
Navigate to the OracleAS Portal metrics page, as shown in Figure 7-3.
Expand the metric node of interest and click the relevant metric link.
From the View Data drop-down list (top right hand corner), choose a suitable time period for analyzing this metric.
Click the Compare Targets link in the Related Links section.
Choose the OracleAS Portal targets that you want to compare, move them to the Selected Targets list box and then click OK.
The comparisons are plotted on the Metric Value History chart.
In the Grid Control Console, you can set up notification alerts to report that certain metrics exceed pre-set thresholds.
Check that the Oracle Enterprise Manager 10g administrator has setup at least one Notification Method for an Outgoing Mail Server, a Script (Operating System Command or PL/SQL) or an SNMP Trap:
Click the Setup link (top right hand corner).
Click Notification Methods.
Once a notification method exists, setup a Notification Rule:
Click the Preferences link (top right hand corner).
Click the Notification Rules link.
From this page you can create a notification rule and choose targets and conditions for which you want to receive notifications in Oracle Enterprise Manager 10g.
In the Grid Control Console, you can define and adjust the thresholds for OracleAS Portal metrics. Thresholds are boundary values against which monitored metric values are compared. You can specify a warning threshold so that when a monitored metric value crosses that threshold, a warning alert is generated. Alerts can notify you of impending problems which you can address in a timely manner.
Editing metric thresholds is useful because you can add or change the thresholds to fit the monitoring needs of your organization. When defining a threshold, choose a value that will not generate too many unnecessary alerts.
To edit OracleAS Portal related metrics, click the Manage Metrics link at the bottom of any OracleAS Portal target page, as shown in Figure 7-2. The metrics listed on the Manage Metrics page are either default metrics provided by Oracle, or metrics with thresholds you can change. For an example, see Figure 7-5.
Figure 7-5 Grid Control Console - OracleAS Portal Edit Metric Thresholds

A list of the most recent alerts are displayed on the OracleAS Portal target page, in the section called Alerts and Host Alerts (see Figure 7-2).
When an alert is generated to notify you of availability or performance problems, you can check the Grid Control Console for more information about the metric that triggered the alert. This includes information on the metric's historical values that might show trends over the past week or month.
In the Grid Control Console, you can use the Web Applications feature to monitor the performance of OracleAS Portal sites. You can monitor the end-user response time, or the performance of representative transactions.
End-User Response Time Monitoring - All URLs based on the application home page (specified in the Web Application properties) are monitored. URLs of particular importance can be identified in a URL Watchlist.
Representative Transaction Monitoring - Recorded application activity (transactions) is played back at regular intervals through client robots (or beacons). The availability of the application is defined as the availability of a selected subset of representative transactions, replayed through selected beacons.
You model the topography of your OracleAS Portal application by adding all the relevant targets to a single Web Application group. For example, you could add the Database and OracleAS Single Sign-On targets used by your OracleAS Portal application to the same Web Application group.
The Oracle Enterprise Manager 10g Application Server Control Console is included when you install Oracle Application Server. From OracleAS Portal's perspective, consider this to be the administration console for the Oracle Application Server. In the Application Server Control Console you can:
Enable and disable components
Administer clusters
Start and stop services
View logs and ports
Perform real-time monitoring
Modify infrastructure services used by an Oracle Application Server middle tier
This section contains information about:
You can access the Application Server Control Console by navigating to the following URL: http://<hostname.domain>:<port>. For example, http://myhost.mycompany.com:1810. You can find the URL for your Application Server Control Console in setupinfo.txt. This text file is saved to the following location after you install the Oracle Application Server:
On UNIX: ORACLE_HOME/install/setupinfo.txt
On Windows: ORACLE_HOME\install\setupinfo.txt
Your start page for the Application Server Control Console is the Oracle Application Server Farm home page. Clicking an instance, takes you to the Oracle Application Server instance home page. This page contains a table of System Components. From this table you can display the home page for each component of the application server for monitoring and administrative purposes.
If OracleAS Portal is configured, Portal:<portal schema name> appears in this table. The default portal schema name is portal.
You can also navigate to Application Server Control Console directly from OracleAS Portal. Click the Administer tab on the Portal Builder page and then click Portal Service Monitoring (by default, this link is located in the Services portlet on the Portal subtab).
|
Note: If any Application Server Control Console details change, for example, the port or protocol, you must update the Portal Service Monitoring link otherwise it will not work. See Section 7.3.11.1, "Updating Oracle Enterprise Manager Link in OracleAS Portal" for instructions. |
If Portal:portal is not listed in the System Components table, it means that OracleAS Portal is not yet configured. The Configure Component button appears above the System Components table if you have installed, but not configured, some Oracle Application Server components.
|
Note: Only components that have the check box selected can be started or stopped. |
To configure OracleAS Portal perform these steps:
On the Oracle Application Server home page, click the Configure Component button.
Select Portal from the drop-down list on the Select Component page, and click Continue.
In the Login page, enter the administration (ias_admin) password for the Oracle Application Server instance in the Administration Password field.
Click Finish.
It may take some time to complete this process (10-20 minutes), depending upon the speed and configuration of your hardware.
When the configuration is complete, click OK.
The Oracle Application Server home page is displayed.
Verify that OC4J_Portal and Portal:portal appear in the System Components table.
Restart Oracle HTTP Server and start OC4J_Portal.
In the System Components table, select HTTP_Server, and click the Restart button.
Select OC4J_Portal, and then click the Start button.
The home OC4J instance will be Down after configuring OracleAS Portal through Oracle Enterprise Manager. If you wish to start this service, click the home component in the System Components table and then click the Start button.
Verify that the status of OC4J_Portal and Portal:portal are both Up:
Click OC4J_Portal and verify that the OC4J_Portal page is displayed.
Click Portal:portal and verify that the Portal page is displayed.
Initially, the Portal:portal status may appear Down. This is normal. The status should be updated approximately five minutes after configuration.
If this is the first instance of OracleAS Portal to use the OracleAS Metadata Repository, run the following command in the middle-tier Oracle home (make sure the ORACLE_HOME environment variable is set before you run this command):
On Unix: ORACLE_HOME/portal/conf/ptlconfig -dad portal [-pw PORTAL_schema_password]
On Windows: ORACLE_HOME\portal\conf\ptlconfig -dad portal [-pw PORTAL_schema_password]
This script writes OracleAS Portal configuration entries into the OracleAS Metadata Repository. Do not run this script if there are other OracleAS Portal instances using the OracleAS Metadata Repository as this script will overwrite any existing OracleAS Portal configuration entries in the OracleAS Metadata Repository.
|
Note: The PORTAL schema password is stored in the Oracle Internet Directory and the entry may be viewed by an administrator using theoidadmin utility with the following path under Entry Management:
|
Verify that you can access OracleAS Portal at the following URL:
http://<hostname.domain>:<port>/portal/pls/portal
In the URL, hostname.domain is the OracleAS Portal host, and port is the OracleAS Web Cache HTTP port number for the OracleAS Portal instance. For example, http://myhost.mycompany.com:7777/portal/pls/portal.
You can log in to OracleAS Portal as the user portal.
If this is the first OracleAS Portal instance to use the OracleAS Metadata Repository, the password is the original ias_admin password you supplied for this middle tier during installation. The original ias_admin password is required, even if you changed the ias_admin password, after installation.
If this is not the first OracleAS Portal instance to use the OracleAS Metadata Repository, the password is either the:
original ias_admin password for the first middle tier associated with the OracleAS Metadata Repository, or
current portal password, if the administrator changed the portal user password after the first OracleAS Portal instance was installed.
For more information, see the Oracle Application Server Administrator's Guide.
|
Note: When OracleAS Portal is configured using Oracle Enterprise Manager, the Oracle Ultra Search instance is not configured automatically and therefore the Ultra Search Administration link in OracleAS Portal will not work. See Section 8.2.4.1, "Accessing the Oracle Ultra Search Administration Tool" for details. |
To monitor and administer OracleAS Portal, click Portal:<portal schema name> in the System Components list on the Oracle Application Server instance home page. The default portal schema name is portal. Note that OC4J_Portal is the container for portal servlets, and not the actual portal servlet to monitor.
Figure 7-6 shows the main page for monitoring OracleAS Portal.
You can access the Oracle Application Server instance home page for your portal directly from OracleAS Portal. Click the Administer tab on the Portal Builder page and then click Portal Service Monitoring (by default, this link is located in the Services portlet on the Portal subtab).
|
Note: If any Oracle Enterprise Manager 10g Application Server Control Console details change, for example, the port or protocol, you must update the Portal Service Monitoring link in OracleAS Portal otherwise it will not work. See Section 7.3.11.1, "Updating Oracle Enterprise Manager Link in OracleAS Portal" for more information. |
Figure 7-6 Application Server Control Console - Main OracleAS Portal Monitoring Page
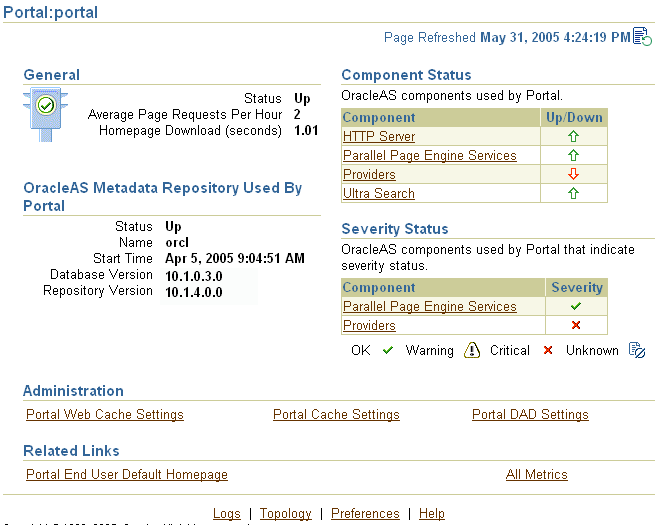
The main OracleAS Portal monitoring page, shown in Figure 7-6, displays various information and links which are described in the following section:
For performance reasons, less critical data, that is, non-response metrics, is collected by the Application Server Control Console metric cache and it can become slightly out of date. To display the most up to date metric data, click the Refresh Data icon.
In addition to the portal metrics available in the Application Server Control Console, the Dynamic Monitoring Service (DMS) collects portal-related metric data from the Parallel Page Engine, and the Providers. DMS starts collecting metric information when the middle tier starts up. DMS metrics are cleared whenever the middle tier is restarted, and a new set of metric data is collected when the middle tier starts up again. To view these metrics, use the DMS monitoring tool, dmstool, which is documented in the Oracle Application Server Performance Guide.
On the main page for OracleAS Portal, in Application Server Control Console, there is a General section that displays important status and performance-related information. Use this section to establish the status of an OracleAS Portal instance, either Up or Down.
You can also see the average number of page requests for each hour, and the current home page download speed.
On the main page for OracleAS Portal, in Application Server Control Console, there is a section called OracleAS Metadata Repository Used By OracleAS Portal. Use this section to view metrics relating to the OracleAS Metadata Repository. This is the repository that contains the OracleAS Portal schema.
You can see if the database that contains the OracleAS Metadata Repository is up and running, and the date and time the database was started. You can also find out the name and version of the database, and the version of the OracleAS Metadata Repository.
In Application Server Control Console, you can specify the OracleAS Web Cache settings that OracleAS Portal should use. From the main OracleAS Portal monitoring page, click the Portal Web Cache Settings link, under Administration, to display the Portal Web Cache Settings page shown in Figure 7-7.
When you set OracleAS Web Cache properties on this page, the Portal Dependency Settings file (iasconfig.xml) located on this middle tier is updated automatically, and the OracleAS Portal schema is also updated. See Appendix A, "Using the Portal Dependency Settings Tool and File" for more details.
|
Notes:
|
Figure 7-7 Application Server Control Console - Portal Web Cache Settings
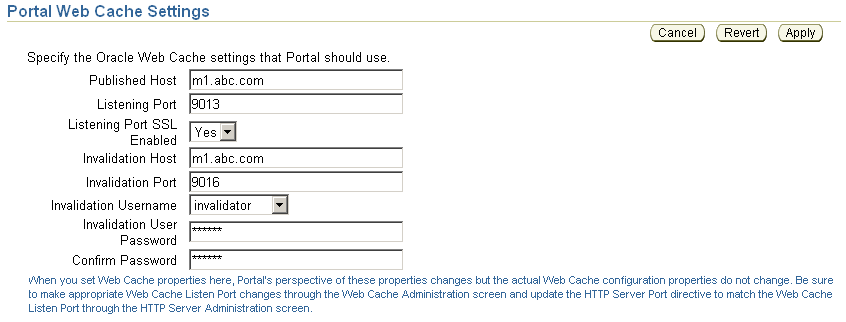
In the Portal Web Cache Settings page, you can modify the settings detailed in Table 7-1:
Table 7-1 Portal Web Cache Settings
| Setting | Description |
|---|---|
|
Published Host |
The published host name. This is the published server host name used in a browser to connect to OracleAS Portal. For example, |
|
Listening Port |
The port on which OracleAS Web Cache listens. For example, |
|
Listening Port SSL Enabled |
Indicates whether OracleAS Web Cache is SSL enabled. Valid values are Yes and No. |
|
Invalidation Host |
The name of the OracleAS Web Cache host to which invalidation messages are sent. Use this only if it is different from the published host name. For example, Typically, the host name and port number used to connect to OracleAS Portal are the OracleAS Web Cache host name and port number. This is because, in a simple configuration, browser requests go directly to OracleAS Web Cache. However, if you have a reverse proxy server front-ending OracleAS Web Cache or a load balancing router (LBR), you can still send invalidation messages directly to the OracleAS Web Cache host instead of the reverse proxy server, or LBR. In this case the published host name should be that of the reverse proxy server, or LBR and the invalidation host name should be that of OracleAS Web Cache. |
|
Invalidation Port |
The number of the OracleAS Web Cache invalidation port, to which invalidation messages are sent. For example, |
|
Invalidation Username |
The user name used for sending the invalidation messages. Either |
|
Invalidation User Password |
The invalidation password. The default is the same as the |
|
Confirm Password |
Repeat the invalidation password. |
Example 7-1 shows how to configure OracleAS Portal to use OracleAS Web Cache on a different host, using the Portal Web Cache Settings page.
Example 7-1 Configuring OracleAS Portal to Use OracleAS Web Cache on a Different Host
To configure OracleAS Portal to use OracleAS Web Cache on a different host from the one on which the OracleAS Portal middle tier is installed:
Access the Application Server Control Console on the middle tier where OracleAS Portal is installed.
Select the portal instance you want to configure, typically, Portal:portal.
Select Portal Web Cache Settings.
Update the Published Host property with the new host name, along with any other property changes you want to make.
Click Apply.
In Application Server Control Console, you can specify content cache and session cache settings for an OracleAS Portal instance. From the main OracleAS Portal monitoring page, click the Portal Cache Settings link, under Administration, to display the Cache Configuration page shown in Figure 7-8.
See Section 1.3.2, "Understanding Portal Cache" for more information.
|
Note: If you change any values on the Cache Configuration page, you must restart Oracle HTTP Server and OC4J_Portal. To do this, navigate to the Oracle Application Server home page, select HTTP_Server and OC4J_Portal in the System Components table, and then click the Restart button. |
Figure 7-8 Application Server Control Console - Portal Cache Settings

In the Cache Configuration page, you can modify the settings detailed in Table 7-2:
Table 7-2 Portal Cache Settings
| Setting | Description |
|---|---|
|
Caching |
Enables (On) or disables (Off) portal content and session caching. |
|
Cache Directory |
The directory where cached content is stored. Note: Ensure that this directory exists and that it is accessible (read/write access required). |
|
Total Cache Size (MB) |
The total amount of disk space (in megabytes) that the portal cache may use. The maximum value allowed is 4 GB. Note: This setting is not a hard limit. The cache may exceed this limit temporarily. |
|
Maximum Cache File Size (bytes) |
Enter the maximum size (in bytes) for all cached files. The maximum value allowed is 4 GB. Any dynamically generated content that exceeds this limit is not cached. |
|
Cleanup Time |
The time at which to start the cleanup of the cache storage. Use the format: The frequency can be set as daily, weekly, and monthly. The default is
|
|
Maximum Age for Cache File (days) |
The maximum age for cached files. This setting ensures the cache system does not contain any old content. Old cache files are removed to make space for new cache files. The default is Note: This setting only affects items in the portal content cache. Session cookie cache items are cleaned if they are in the cache for more than 1 day. |
In Application Server Control Console, you can edit the DAD (Database Access Descriptor) for an OracleAS Portal instance. Click the Portal DAD Settings link, under Administration, to display the Edit DAD Database Connection page shown in Figure 7-9.
|
Note: If you make any changes on the Edit DAD pages, you must restart Oracle HTTP Server and OC4J_Portal. To do this, navigate to the Oracle Application Server home page, select HTTP_Server and OC4J_Portal in the System Components table, and then click the Restart button. |
See Section 4.5.3, "Configuring a Portal DAD" for more information.
Figure 7-9 Application Server Control Console - Portal DAD Settings
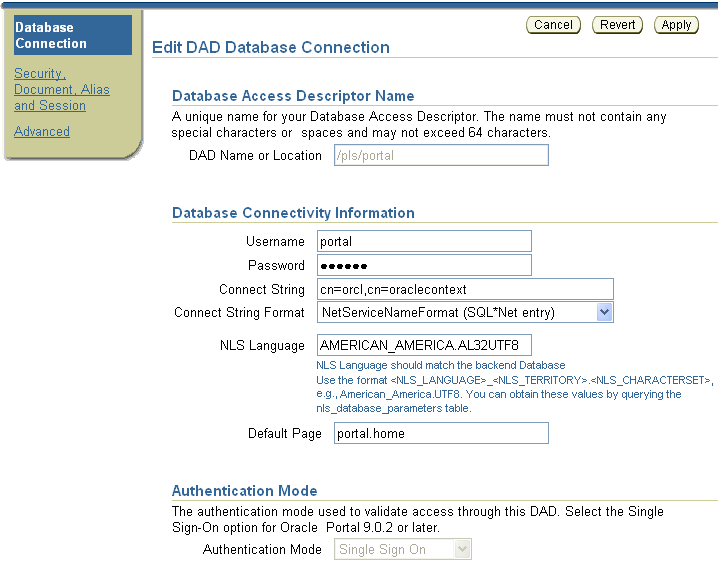
In the Edit DAD Database Connection page, you can modify the DAD settings detailed in Table 7-3:
Table 7-3 DAD Settings
| Setting | Description |
|---|---|
|
Username |
The Oracle Database account username. |
|
Password |
The Oracle Database account password. The password is typically set at installation but you can change it by typing a new password in this field. Use this field to set the password for a nondefault OracleAS Portal instance. For the default OracleAS Portal instance, we recommend that you set the password through the Infrastructure page in Application Server Control Console. This way, password changes are propagated to the database, Oracle Internet Directory, and the DAD. See Section 5.12, "Changing the OracleAS Portal Schema Password" for more information. |
|
Connect String |
The connection string (if the database is remote) and then use the Connection String Format as described subsequently to specify the format of the connect string you have entered here. |
|
Connect String Format |
The format used for the Connect String property. The options are:
If the Connection String Format is not specified, the connect string format is assumed to be either SIDFormat (host:port:sid) or, resolvable as NetServiceNameFormat. The differentiation between the two is made by the presence of colon characters (:) in the connect string. For database installations like Real Application Clusters (RAC), the recommended connect string format is NetServiceNameFormat so that the lookup is through LDAP. This allows database nodes to be for added/removed without having to reconfigure each Oracle Application Server middle tier separately to recognize added/removed nodes. |
|
NLS Language |
The Globalization Support language of the OracleAS Portal database that is represented by this DAD. This setting overrides the NLS_LANG environment variable for a database session and defines some important Globalization Support properties of the response, including the response character set. For OracleAS Portal, this setting should match the NLS_LANG of the back-end database. For example, if you set this parameter is to Tip: To obtain the settings of this parameter, query the nls_database_parameters table as follows:
Refer to the Oracle HTTP Server Administrator's Guide, for more details on the parameter PlsqlNLSLanguage. |
|
Default Page |
The PL/SQL procedure that is invoked when one is not specified as part of the URL. For example, if you specify a default home page of
The URL is automatically updated to:
|
|
Security, Document, Alias and Session |
Links to additional DAD settings: Request Validation Function, Exclusion List, Document Access Information (Document Table, Document Path, Document Access Procedure, Long Raw), Path Alias, Session Cookie Name, Session State Management. For more information, click the Help link on the Edit DAD Security, Document, Alias and Session page. |
|
Advanced |
Links to advanced DAD settings: Always Describe Procedures, Before Procedure, After Procedure, Fetch Buffer Size (rows). For more information, click the Help link on the Edit DAD Advanced page. |
The Component Status table, on the main page for OracleAS Portal in Application Server Control Console, lists the Oracle Application Server components used by OracleAS Portal and indicates their current status. You can drill down and find more information about individual Oracle Application Server components, by clicking on a link. The listed components are:
Clicking the HTTP Server link, in the Component Status table, takes you to the home page for the Oracle HTTP Server. This is the starting point for managing a single instance of Oracle HTTP Server. For example, you can restart the Oracle HTTP Server from here.
Clicking the Parallel Page Engine Services link, in the Component Status table, takes you to the Parallel Page Engine Services page shown in Figure 7-10. Detailed Parallel Page Engine (PPE) metrics are displayed on this page.
|
See Also: Refer to Appendix D, "Configuring the Parallel Page Engine" for more information about the PPE. |
Figure 7-10 Application Server Control Console - Parallel Page Engine Services Monitoring Page
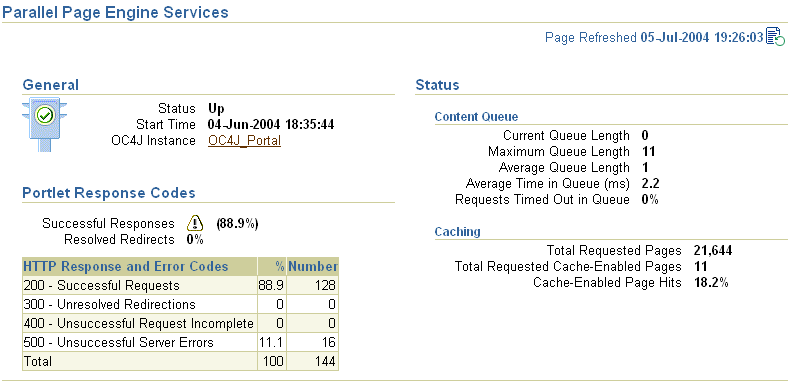
In the Component Status table, the status of Providers is shown to be Up when none of the portlets' last response codes indicated a failure, and the slowest average portlet performance is quicker than the portlet performance warning threshold.
Clicking the Providers link, in the takes you to the Providers monitoring page. From here you can get an overview of the performance, status, and HTTP response codes (portlets only) of providers and portlets that are requested by the Parallel Page Engine (PPE) in the Application Server Control Console.
The performance of Web Providers, Database Providers, and WSRP Providers are summarized at the top of the Providers page, as shown in Figure 7-11.
Figure 7-11 Application Server Control Console - Provider Summary

You can click a provider to get details about individual portlets that have been accessed through that provider.
Figure 7-12 Application Server Control Console - Database Providers

Figure 7-13 Application Server Control Console - Web Providers

Figure 7-14 Application Server Control Console - WSRP Providers

Metrics you can monitor include:
Requests - The number of requests serviced by this provider.
Avg Time (seconds) - The average response time to request a portlet.
Max Time (seconds) - The maximum response time to request a portlet.
Slowest Portlets Avg Time (seconds) - The average performance of a provider's slowest portlet (in seconds).
Cache Hits - The number of times the cache has been accessed.
Performance - Indicates whether the providers are performing as expected.
Online - Indicates if a provider is currently online.
Status - Indicates whether a specific provider is Up or Down.
The status of a portlet is considered to be Up if no portlets' last response code indicated a failure, and the slowest average portlet performance is quicker than the portlet performance warning threshold set for the target. The status appears Down if the last response code for at least one portlet indicates a failure.
Clicking the Ultra Search link, in the Component Status table, takes you to the Oracle Ultra Search administration pages. From here you can configure Oracle Ultra Search. See Chapter 8, "Configuring the Search Features in OracleAS Portal" for more information.
The Severity Status table, on the main page for OracleAS Portal in Application Server Control Console, lists the Oracle Application Server components used by OracleAS Portal that indicate severity status. Table 7-4 describes the severity status levels that are reported.
|
Note: Severity level thresholds are set intargets.xml. See section "Setting Severity Thresholds Manually in targets.xml" for more information.
|
Table 7-4 Severity Level Status Descriptions
| Item | Description |
|---|---|
|
OK |
The component is running normally. |
|
Warning |
There is some problem with the component. |
|
Critical |
The component is having critical problems. |
|
Unknown |
There is not enough information to establish the status as the component is down. |
Setting Severity Thresholds Manually in targets.xml
In the Grid Control Console, you can define and adjust the thresholds for OracleAS Portal metrics using the Manage Metrics link (see Section 7.1.4, "Setting OracleAS Portal Metric Thresholds" for information). This feature is not available in the Application Server Control Console but you can edit the severity level thresholds manually, in the Oracle Enterprise Manager configuration file targets.xml, if necessary.
For the Application Server Control Console, this file is located at ORACLE_HOME/sysman/emd/targets.xml, where ORACLE_HOME is the Oracle Application Server Home. You can edit the following threshold values:
PPESuccessfulResponsesCriticalThreshold - A threshold value used by OracleAS Portal to determine whether the status of the Parallel Page Engine Services is reported to be critical, that is, when the percentage of successful responses drops below this value. The default is 80%.
PPESuccessfulResponsesWarningThreshold - Parallel Page Engine Services are considered to be in a warning state if the percentage of successful responses is higher than PPESuccessfulResponsesCriticalThreshold and lower than this value. The default is 90%.
portletResponseCriticalThreshold - A threshold value used by OracleAS Portal to determine whether the status of a Provider's Portlet Timing is reported to be critical, that is, when the average portlet response time (in milliseconds) is greater than this value (in milliseconds). The default is 4500 milliseconds.
portletResponseWarningThreshold - Portlet response times are considered to be in a warning state if the average response time for Provider portlets is less than PPESuccessfulResponsesCriticalThreshold and greater than this value (in milliseconds). The default is 4000 milliseconds.
If you do edit metric thresholds manually in targets.xml, you must reload the configuration file in the appropriate Application Server Control Console. Follow these steps to update targets.xml in the Oracle Application Server 10g home (ORACLE_HOME) and load the new target information in the Application Server Control Console:
Create a backup copy of ORACLE_HOME/sysman/emd/targets.xml. For example, ORACLE_HOME/sysman/emd/targets.xml.30thJune2005.
Open ORACLE_HOME/sysman/emd/targets.xml in your favorite Text Editor.
Edit the XML segment describing your OracleAS Portal target thresholds.
<Target TYPE="oracle_portal" NAME="Name" DISPLAY_NAME="Display_Name" VERSION="1.0">
   ...
   <Property NAME='PPESuccessfulResponsesCriticalThreshold' VALUE='80' />
   <Property NAME='PPESuccessfulResponsesWarningThreshold' VALUE='90' />
   <Property NAME='portletResponseCriticalThreshold' VALUE='4500' />
   <Property NAME='portletResponseWarningThreshold' VALUE='4000' />
    ...
  </Target>
Reload the targets in the Application Server Control Console:
On Solaris/Linux:
ORACLE_HOME/bin/emctl reload
On Windows:
ORACLE_HOME\bin\emctl reload
The Related Links section, on the main page for OracleAS Portal in Application Server Control Console, contains several links:
Portal End User Default Homepage - This link takes you to the home page for the OracleAS Portal instance.
All Metrics - This link displays a single comprehensive list of all the metrics available for this OracleAS Portal instance. It is not possible to view historical metric data from the Application Server Control Console but you can start collecting metric data and display the results graphically in real-time.
To analyze historical trends, use the Grid Control Console. See Section 7.1.1, "Monitoring Historical Trends" for more information.
A Logs link is displayed at the top and bottom of every Oracle Application Server component home page. Click the Logs link on any OracleAS Portal instance home page to view detailed diagnostic information for that OracleAS Portal instance.
See Appendix K, "Troubleshooting OracleAS Portal" for more information.
A Topology link is displayed at the top and bottom of every Oracle Application Server component home page. Click the Topology link to display a graphical representation of your Oracle Application Server environment, including the Oracle Application Server processes that are running OracleAS Portal instances, such as, Web Cache, OC4J_Portal and HTTP Server.
This section contains the following sections:
In OracleAS Portal there is a link to the Application Server Control Console that is monitoring and managing the portal. To access the Portal Service Monitoring link, click the Administer tab in OracleAS Portal (Builder page) and then locate the Services portlet.
If any details relating to the Application Server Control Console change, for example, the port or protocol, the link in OracleAS Portal must be updated otherwise it will not work.
To do this, follow these steps:
Edit the file iasconfig.xml on the OracleAS Portal middle tier.
This is usually located in ORACLE_HOME/portal/conf. See Appendix A, "Using the Portal Dependency Settings Tool and File" for more information.
Update the EMComponent element for your OracleAS Portal instance, as required.
Run the following script to update the Oracle Application Server Metadata Repository with the new settings:
ORACLE_HOME/portal/conf/ptlconfig -dad <dad> -em
Clear the content of the portal cache directory ORACLE_HOME/Apache/modplsql/cache/plsql/sys:
Navigate to the portal cache directory (default path is ORACLE_HOME/Apache/modplsql/cache).
Perform a recursive delete of all the files under ORACLE_HOME/Apache/modplsql/cache/plsql/sys. For example, on UNIX platforms, issue the following command:
rm -rf ORACLE_HOME/Apache/modplsql/cache/plsql/sys
In OracleAS Portal, clear the content of OracleAS Web Cache to update the Portal Service Monitoring link.
In the Services portlet, click Global Settings.
By default, the Services portlet is located on the Administer tab of the Portal Builder page.
Click the Cache tab and then select Clear The Entire Web Cache.
Click OK.
In the Services portlet, click the updated Portal Service Monitoring link to access the Application Server Control Console.
The configuration file targets.xml defines attributes for all the targets managed by Oracle Enterprise Manager, including your OracleAS Portal targets. For the most part, the content of targets.xml is maintained automatically, so there is no need to edit this file manually. However, when the Oracle HTTP Server in your environment is SSL enabled, you must maintain Oracle HTTP Server port changes manually (in targets.xml) for all OracleAS Portal targets running on that server. If the HTTP Port information in targets.xml does not match the actual listening port of the Oracle HTTP Server, the targets appear to be down in the Oracle Enterprise Manager 10g Application Server Control Console.
So, whenever Oracle HTTP Server listening port details are changed, either in the configuration file httpd.conf, or using the Oracle HTTP Server's administration pages in Oracle Enterprise Manager, update the corresponding property (HTTPPort) in targets.xml manually as described in the following sections.
If OracleAS Web Cache is SSL-enabled, the PortalListeningHostPort property must be changed too.
Follow the steps appropriate to your SSL environment:
SSL-enabled Oracle HTTP Server and non-SSL OracleAS Web Cache
Non-SSL Oracle HTTP Server and SSL-enabled OracleAS Web Cache
SSL-enabled Oracle HTTP Server and SSL-enabled OracleAS Web Cache
|
Note: Manual configuration is not required in non-SSL environments. |
SSL-enabled Oracle HTTP Server and non-SSL OracleAS Web Cache
Make a backup copy of targets.xml located in the MID_TIER_ORACLE_HOME/sysman/emd directory.
Open MID_TIER_ORACLE_HOME/sysman/emd/targets.xml in a text editor.
Search for OracleAS Portal targets, that is, TYPE="oracle_portal".
Change the HTTPProtocol property value from http to https. For example:
<Property NAME="HTTPProtocol" VALUE="https"/>
Change the HTTPPort property value so that it matches the SSL-enabled Oracle HTTP Server listening port value. For example:
<Property NAME="HTTPPort" VALUE="7782"/>
To verify the current listening port of the Oracle HTTP Server, look in httpd.conf and determine the value of the Listen property. Alternatively, click the Site link on the OracleAS Web Cache Administration page and determine the port number displayed in the Origin Servers field.
Save the changes to targets.xml.
Configure Enterprise Manager to monitor the SSL-Enabled targets. To do this, follow the instructions provided in the Oracle Application Server Administrator's Guide.
Non-SSL Oracle HTTP Server and SSL-enabled OracleAS Web Cache
Make a backup copy of targets.xml located in the MID_TIER_ORACLE_HOME/sysman/emd directory.
Open MID_TIER_ORACLE_HOME/sysman/emd/targets.xml in a text editor.
Edit the PortalListeningHostPort property, which is the OracleAS Web Cache route for some of the status metrics. Replace http with https. For example:
<Property NAME="PortalListeningHostPort" VALUE=https://<host>:<Web Cache port>/>
Save the changes to targets.xml.
Configure Enterprise Manager to monitor the SSL-Enabled targets. To do this, follow the instructions provided in the Oracle Application Server Administrator's Guide.
SSL-enabled Oracle HTTP Server and SSL-enabled OracleAS Web Cache
Make a backup copy of targets.xml located in the MID_TIER_ORACLE_HOME/sysman/emd directory.
Open MID_TIER_ORACLE_HOME/sysman/emd/targets.xml in a text editor.
Search for OracleAS Portal targets, that is, TYPE="oracle_portal".
Change the HTTPProtocol property value from http to https. For example:
<Property NAME="HTTPProtocol" VALUE="https"/>
Change the HTTPPort property value so that it matches the SSL-enabled Oracle HTTP Server listening port value. For example:
<Property NAME="HTTPPort" VALUE="7782"/>
To verify the current listening port of the Oracle HTTP Server, look in httpd.conf and determine the value of the Listen property. Alternatively, click the Site link on the OracleAS Web Cache Administration page and determine the port number displayed in the Origin Servers field.
Edit the PortalListeningHostPort property, which is the OracleAS Web Cache route for some of the status metrics. Replace http with https. For example:
<Property NAME="PortalListeningHostPort" VALUE=https://<host>:<Web Cache port>/>
Save the changes to targets.xml.
Configure Enterprise Manager to monitor the SSL-Enabled targets. To do this, follow the instructions provided in the Oracle Application Server Administrator's Guide.
You can choose how objects and actions are logged in OracleAS Portal and generate reports for analyzing the data. For example, you can add an entry into the Activity Log tables every time OracleAS Portal users create, edit or delete a particular page.
Any authorized user can view the OracleAS Portal Log Registry records. However, only the portal administrator can set up what information is to be logged. See Section 7.4.2, "Choosing Which Events Are Logged" for more information.
Table 7-5 lists the events that can be logged for portal objects.
Table 7-5 Logged Events for OracleAS Portal Objects
| Portal Object | Event |
|---|---|
|
Pages |
Create, Edit, Delete, Personalize |
|
Items |
Create, Edit, Delete, Move, Check Out, Check In |
|
Application Components |
Create, Edit, Delete, Execute (except for Reports, Charts, and Hierarchies), Copy, Export, Rename, Generate, Access Control, Manage, Insert, Update, Save |
|
Portlets |
Add to Page, Delete from Page |
|
Portlet Instances |
Hide, Personalize |
|
Searches |
Search |
|
Note: User and Group actions such as Create, Edit, and Delete are logged by Oracle Internet Directory and may be viewed from Oracle Directory Manager, if logging is enabled. For more information, refer to the Oracle Internet Directory Administrator's Guide. |
You can choose which events are logged in OracleAS Portal Log Registry records.
In the Services portlet, click Log Registry Administration.
|
Note: By default, the Services portlet is on the Portal subtab of the Administer tab on the Portal Builder page. |
The Administer Log Registry page is displayed as shown in Figure 7-15.
Figure 7-15 shows two logging requests. The first creates an entry in the Activity Log every time a portlet is personalized. The second creates an entry every time a page is created. If you want to log all possible requests, choose % for each field.
Do one of the following:
Click Add New Log Registry Record to create a new Log Registry record and specify logging criteria.
Or,
Edit logging criteria for an existing Log Registry record. To do this, perform the following steps:
Click the Edit icon to edit logging criteria for an existing Log Registry record (under Edit/Delete Log Registry Record).
The Edit Log Registry Record page is displayed as shown in Figure 7-16.
Figure 7-16 Edit Log Registry Record page
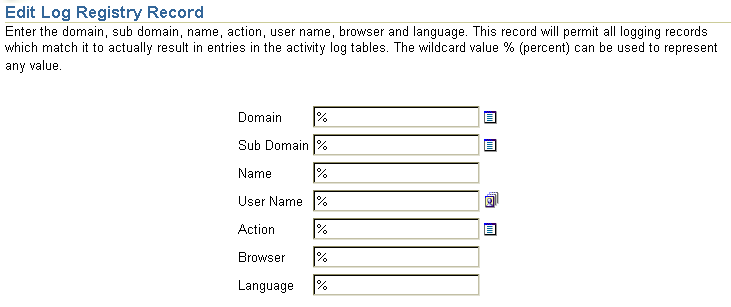
Choose the objects that you wish to log, from the Sub Domain list. Valid objects are listed in Table 7-5.
Choose which actions (or events) you want to log, from the Action list. Valid actions are listed in Table 7-5.
Specify other logging criteria as required.
Click OK.
Several Activity Log views are available (named wwlog_*). These views exist in the schema in which OracleAS Portal is installed. These views are granted to public; however, the logs are secure according to the object's security. For example, information about pages is available only on pages for which the user has access privileges.
Table 7-6 lists all the Activity Log views and their descriptions. You can create simple OracleAS Portal DB Provider reports and charts based on these views if required.
Table 7-6 Activity Log Views
| Log View | Description |
|---|---|
|
wwlog_portal_admin_logs |
All logs (only has records if the user is the portal administrator). |
|
wwlog_user_logs |
All logs created by current user. |
|
wwlog_all_portlet_logs |
Portlet instances on pages that the current user can view. |
|
wwlog_all_document_logs |
Documents that the current user can view. |
|
wwlog_all_search_logs |
Searches that the current user can view. |
|
wwlog_all_item_logs |
Items that the current user can view. |
|
wwlog_all_component_logs |
Components that the current user can view. |
|
wwlog_all_object_logs |
Summary view, which encompasses all the preceding views. |
You can also access information in the Activity Log views from outside of the OracleAS Portal browser-based interface, that is, using SQL*Plus, OracleAS Reports Services, and so on. To do this, you must first set the portal security context for your database session using the wwctx_api.set_context API:
wwctx_api.set_context (
   p_user_name => 'portal_username',
   p_password  => 'portal_pw'
);
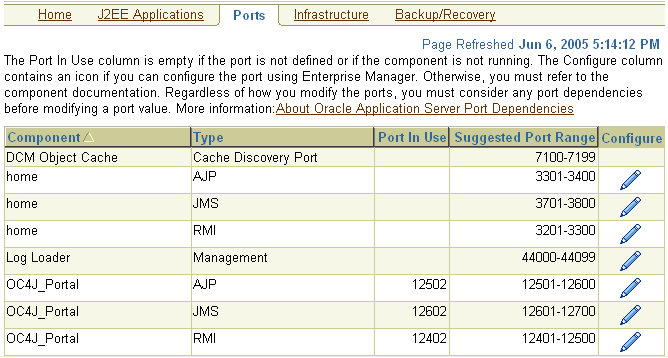
In Application Server Control Console, the Application Server Ports page shows a list of all the ports currently in use by the components of a particular Oracle Application Server instance. This page is important when you are troubleshooting port conflicts among the various Oracle Application Server components.
Whenever possible, Application Server Control Console provides a link to the appropriate Oracle Enterprise Manager 10g configuration page where you can modify the port settings for the component.
To access port information for your Oracle Application Server:
Access the Application Server Control Console. See Section 7.2.1, "Accessing the Application Server Control Console" for details.
If there is more than one standalone application server instance, your start page for the Application Server Control Console is the Oracle Application Server Farm home page.
Click an instance to take you to the Oracle Application Server instance home page.
Click the Ports link to display port information, as shown in Figure 7-17.
Figure 7-17 Oracle Application Server Ports Page
For information on managing ports, refer to the Oracle Application Server Administrator's Guide.