|
Oracle® Reports Building Reports
10g Release 2 (10.1.2) B13895-01 |
|
 Previous |
 Next |
|
Oracle® Reports Building Reports
10g Release 2 (10.1.2) B13895-01 |
|
 Previous |
 Next |
This chapter provides an overview of the example reports in this manual. For information on accessing the demo reports and the data sources, refer to "Accessing the Example Reports" and "Accessing the Data Sources".
The chapter lists the example reports contained in this manual, a brief description of each report, a pointer to the location of the steps to build the example, and an image of the sample output.
This part of the manual introduces and explains the basic steps on how you can build reports.
In this example, you will use the Report Wizard to build a simple tabular report.
Figure 4-1 Final output of the tabular report example

For more information on building this example, refer to Chapter 5, "Building a Tabular Report".
In this example, you will use the Report Wizard to build a simple mailing label report. The steps will show you how to fill out the provided template to format your mailing labels.
Figure 4-2 Final output of the mailing label report example

For more information on building this example, refer to Chapter 6, "Building a Mailing Label Report".
In this example, you will use the Report Wizard to build a simple form letter report. The steps will show you how to fill out the provided template to design your form letter.
Figure 4-3 Final output of the form letter example
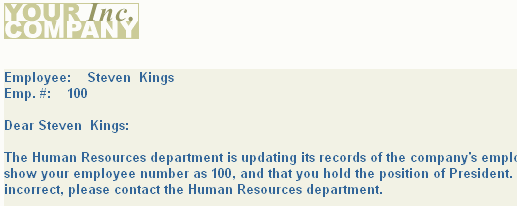
For more information on building this example, refer to Chapter 7, "Building a Form Letter Report".
In this example, you will learn how to build a master/master report, which displays at least two sets of data which are not directly related. That is, the records constituting the data are fetched using at least two separate queries. A master/master report (also called a parent/parent report) contains two or more queries with no links (parent/child relationships).
Figure 4-4 Final output of the first master/master report example
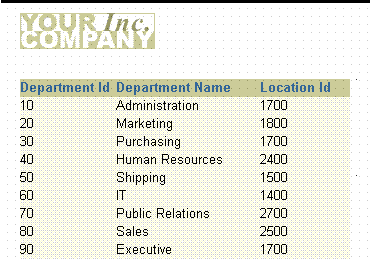
Figure 4-5 Final output of the second master/master report example

For more information on building this example, refer to Chapter 8, "Building a Master/Master Report".
In this example, you will learn how to use the Summary Column tool to create a summary report.
A summary report contains at least one column whose value or values consist of a summary of other data. A column that totals sales, a column that averages a list of commissions, and a column that shows the maximum amounts found in a series of purchase orders are all examples of summary columns.
Figure 4-6 Final output of the summary report example
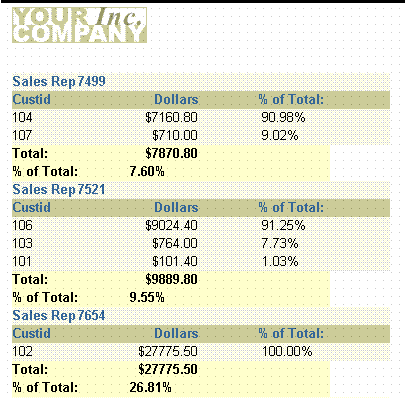
For more information on building this example, refer to Chapter 9, "Building a Summary Report".
This part of the manual explains the different kinds of report layouts.
In this example, you will build a simple group left report using one query.
Group left and group above reports divide the rows of a report into "sets," based on common values in one or more of the columns, such as the department number in the preceding example. In the sample output below, notice that each department number prints only once. If the report above was not a group report, the department number would print once for each employee in the department rather than just once for the whole department.
Figure 4-7 Final output of the single-query group report example

For more information on building this example, refer to Chapter 10, "Building a Single-Query Group Report".
In this example, you will build a group above report using two queries.
A two-query group report appears much the same as a single-query group report. Performance is the key issue when contrasting single-query and multiple-query group reports. In most cases, single-query reports will run faster than multiple-query reports. Multiple-query reports are, however, sometimes easier to understand conceptually and easier to maintain. For example, if you are in a situation where only a few users run the report and the report returns a relatively small number of records, you might want to use multiple queries to simplify maintenance and make the data model easier to understand. If you have many users and the report is quite large, then you should try to use a single-query report.
Figure 4-8 Final output of the two-query group report example
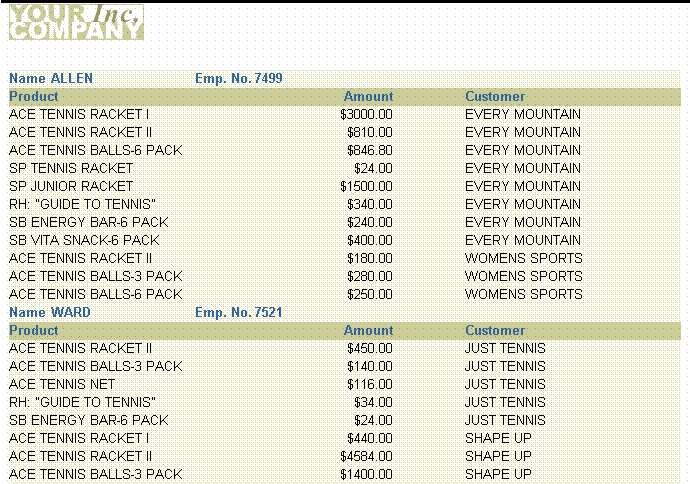
For more information on building this example, refer to Chapter 11, "Building a Two-Query Group Report".
In this example, you will build an across group report that prints the values of a database column across the page instead of down.
Figure 4-9 Final output of the across group report example

For more information on building this example, refer to Chapter 12, "Building an Across Group Report".
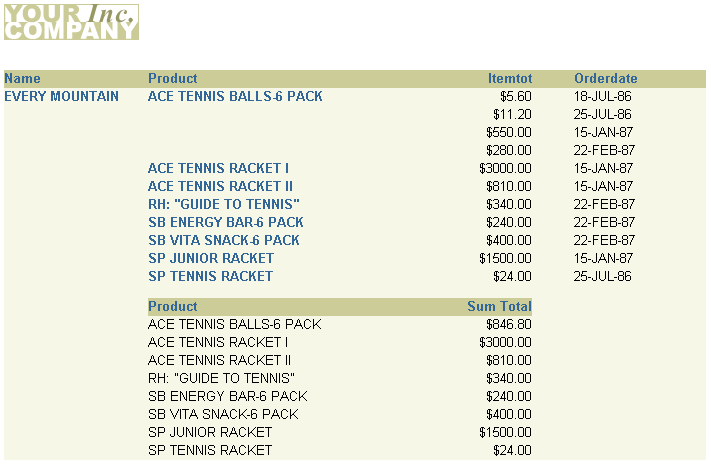
In this example, you will build a summary report that groups the summaries on the left in the report output.
This report consists of master records (Name, at the upper left of the figure below), detail records (Product, Itemtot, and Orderdate, to the upper right), and summary records (Product, and Sum Total). The summary calculates totals for the details under each master record. Notice that the column Product appears twice. With Reports Builder, you can display columns any number of times.
Figure 4-10 Final output of the group left summary report example
For more information on building this example, refer to Chapter 13, "Building a Group Left Summary Report".
In this example, you will use the Report Wizard to set up your report and write the one query that selects all the necessary database columns. You will then manually create the two formula columns to calculate tax and order totals for each customer, then add the formula columns to your report. You will use a Group Left style report to make the data in the report easy to read.
Figure 4-11 Final output of the group left formula report example

For more information on building this example, refer to Chapter 14, "Building a Group Left Formula Report".
This part of the manual explains how you can build reports with special formats.
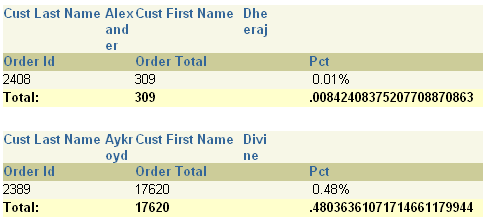
In this example, you will build a break report where the line wraps on word boundaries if it is too long to fit on one line.
Figure 4-12 Final output of the wrapped field report example
For more information on building this example, refer to Chapter 15, "Building a Wrapped Field Report".
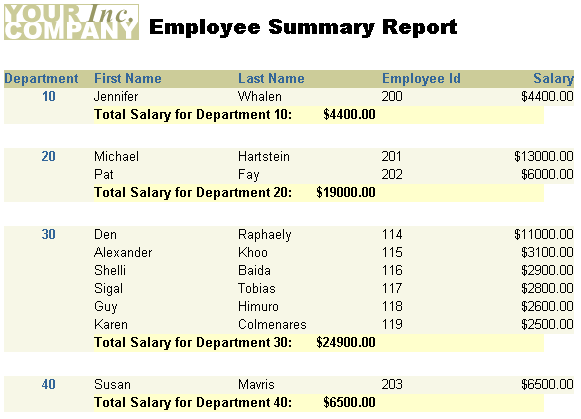
In this example, you will build a report that has a page header printed in the upper margin area of every page of the report, and a footer printed at the end of the list of employee information for each department.
Figure 4-13 Final output of the header and footer report example
For more information on building this example, refer to Chapter 16, "Building a Header and Footer Report".
In this example, both the first and last department numbers found on each page are displayed in the page header.
Figure 4-14 Final output of the header with database values report example

For more information on building this example, refer to Chapter 17, "Building a Header with Database Values Report".
In this example, you will build a report and enhance it by adding an image to the margin, a title, and a border. You will also change the look of the report by applying different fonts and text styles.
Figure 4-15 Final output of the graphics, text, and color example

For more information on building this example, refer to Chapter 18, "Building a Report with Graphics, Text, and Color".
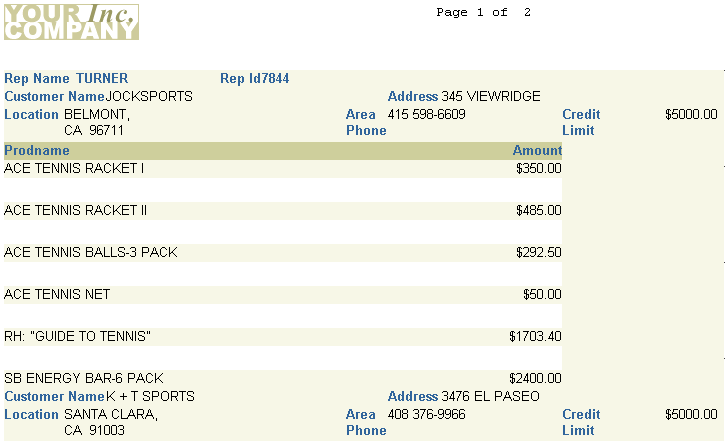
In this example, you will build a report that numbers pages using the format "Page X of Y Pages". The first number (X) corresponds to the current page for each parent record (that is, each sales representative). This page number is reset to "1" for each sales representative, thus tracking the statistics of each representative separately.
Figure 4-16 Final output of the renumbering pages by repeating frame example
For more information on building this example, refer to Chapter 19, "Building a Report that Renumbers Pages by Repeating Frame".
In this example, you will build a report where the group field appears between its related fields. Normally, a group (break) field appears to the left of (in group left report) or above (in group above report) its related fields.
Figure 4-17 Final output of the intermixed fields report example
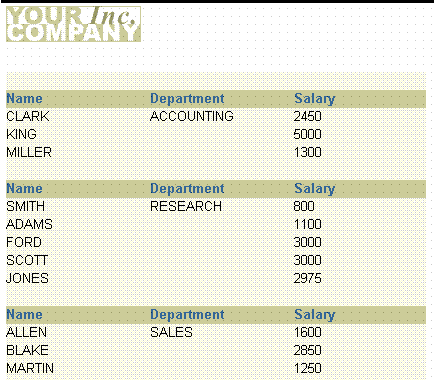
For more information on building this example, refer to Chapter 20, "Building an Intermixed Fields Report".
In this example, you will build a master/detail report that fetches a master record with no associated details. In the sample output below, notice how the field labels for Department 40 do not display because no detail records were found. In this chapter, you will learn how to suppress the detail information for a single record, but allow the other master/detail records to display.
Figure 4-18 Final output for the suppressing labels example
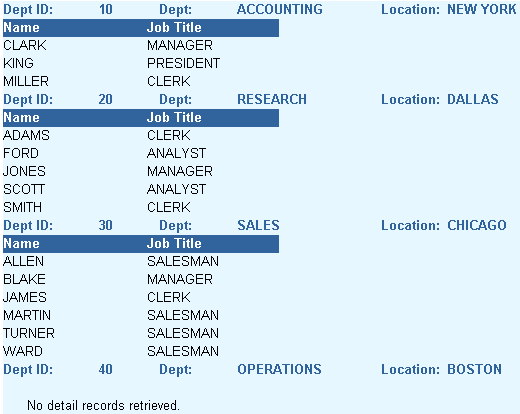
For more information on building this example, refer to Chapter 21, "Building a Report that Suppresses Labels".
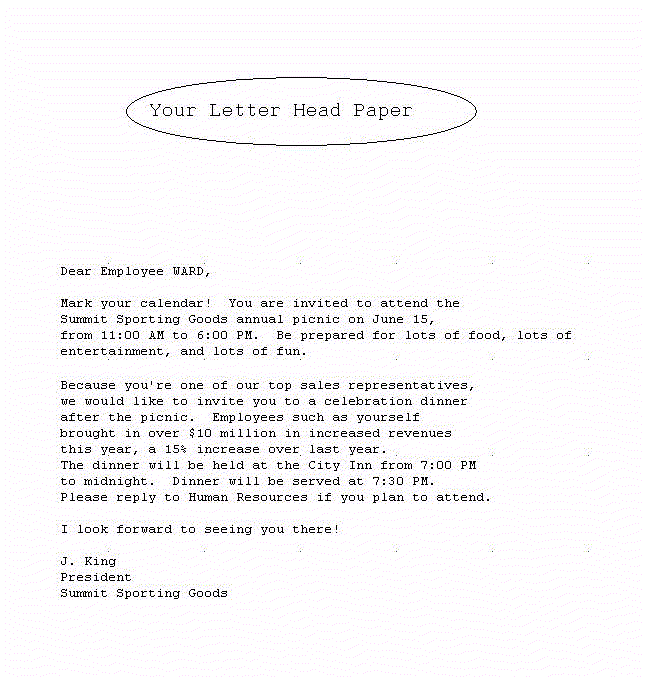
In this example, you will build two form letters from the same report, as shown in the sample output below. As you can see, the two letters share a number of features. Hence, it is more convenient to create a base form letter and then apply conditions to certain parts to determine whether they should be displayed for the current record, in this case, employees.
Figure 4-19 Final output for the first conditional form letter report example
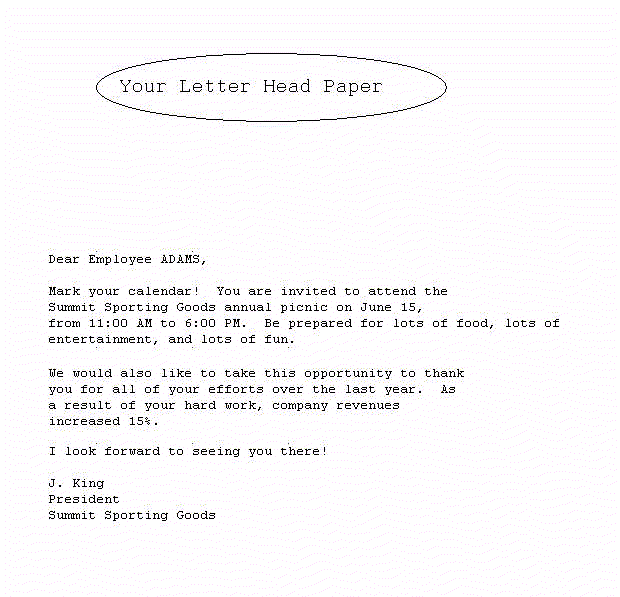
Figure 4-20 FInal output for the second conditional form letter report example
For more information on building this example, refer to Chapter 22, "Building a Conditional Form Letter Report".
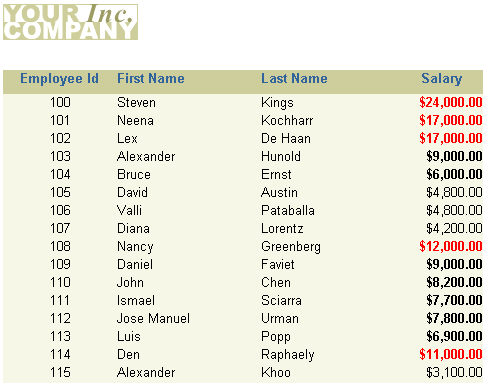
In this example, you will learn how to highlight data in your report. In this report that shows employee salaries, salaries that are greater than or equal to 10,000 are displayed in bold and in red color, and values that are between 4,999 and 10,000 are displayed in bold. Using the Conditional Formatting dialog box in Reports Builder, you can create format triggers that will change the appearance of retrieved data depending on factors you define.
Figure 4-21 Final output of the conditional highlighting report example
For more information on building this example, refer to Chapter 23, "Building a Report with Conditional Highlighting".
In this example, you will build an employee report with a bar graph that displays monthly revenues for the company. Since the data in it changes monthly, you cannot import or draw the graph.
Figure 4-22 Final output of the dynamic graphics report example

For more information on building this example, refer to Chapter 24, "Building a Report with Dynamic Graphics".
This part of the manual explains how you can build various kinds of matrix reports.
A matrix report looks like a grid. As shown in the sample output below, it contains one row of labels, one column of labels, and information in a grid format that is related to both the row and column labels. (Matrix reports are also sometimes referred to as "crosstab" reports.)
In this example, you will build a matrix report that contains three additions to the basic matrix: summaries have been added, zeroes replace non-existent values in the cells, and the cells themselves are surrounded by grid lines. Of the summaries, one sums the salaries by department, one sums them by job, and one sums them for the whole report.
Figure 4-23 Final output of the matrix report example

For more information on building this example, refer to Chapter 25, "Building a Matrix Report".
In this example, you will build the nested matrix report shown below. The cross product is capable of displaying every possible value for three dimensions: two down (YEAR and DEPTNO) and one across (JOB). This method does not include rows that have null values.
Figure 4-24 Final output of the nested matrix report example

For more information on building this example, refer to Chapter 26, "Building a Nested Matrix Report".
In this example, you will build a report that shows department, job, and salary information for each employee by the year they were hired using a matrix break format.
Figure 4-25 Final output of the matrix with group above report example

For more information on building this example, refer to Chapter 27, "Building a Matrix with Group Above Report".
This part of the manual explains how you can build various kinds of reports to suit your business requirements.
In this example, you will build a report that calculates and displays the four-month average of purchases for each customer. You will use the Report Wizard to create a simple time series calculations report for both paper and the Web. For the JSP-based Web report, you will modify the Web source to change labels and add format masks.
Figure 4-26 Final output of the time series calculations report example

For more information on building this example, refer to Chapter 28, "Building a Time Series Calculations Report".
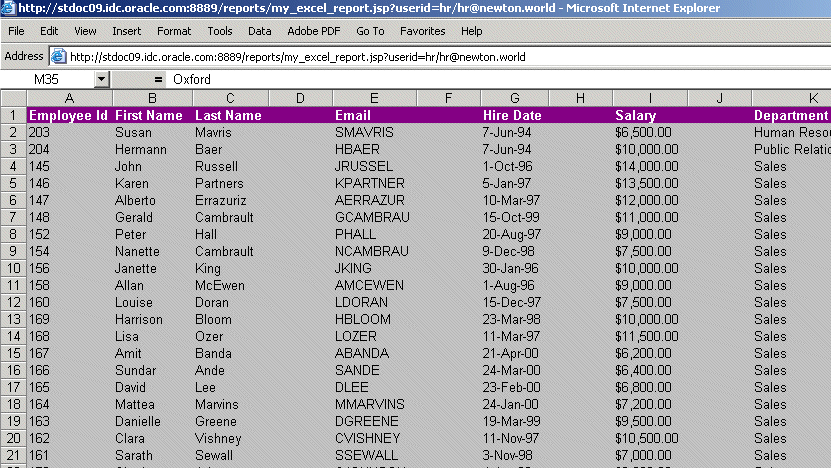
In this example, you will deploy a report with the Reports Server under OC4J to display it in Microsoft Excel inside your Web browser, when you have an existing paper layout. You will generate a report to Microsoft Excel output after integrating the paper layout into a Web layout by modifying the Web source of your report.
Figure 4-27 Final output of the Microsoft Excel report
For more information on building this example, refer to Chapter 29, "Building a Report for Spreadsheet Output".
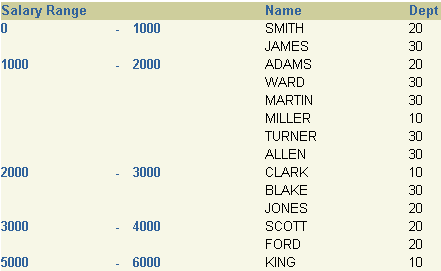
In this example, you will build a report that collects and displays names of all employees whose salaries fall within the range of 0 to 999, then collects and displays all employees whose salaries fall within the range of 1000 to 1999, and so on. You will be able to modify this report to display any aggregate range you need.
Figure 4-28 Final output of the aggregate data report example
For more information on building this example, refer to Chapter 30, "Building a Report with Aggregate Data".
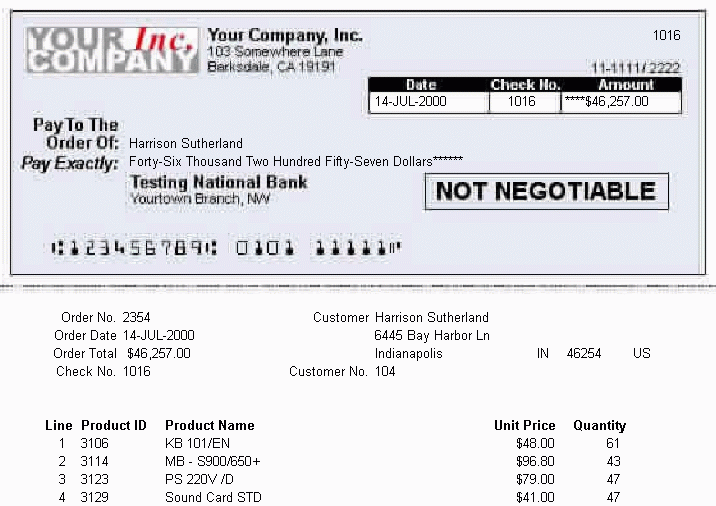
In this example, you will build a check printing report with a stub and spelled-out cash amounts. The steps described in this example will help you create a PL/SQL function that returns spelled-out numerical values. You will also learn how to import an image of a preprinted form (in this case, a blank check image) and use the tools in the Paper Layout and Paper Design views to print your report on such a form. Although we use a check as the example in this report, you can use the steps to use any preprinted form with Oracle Reports.
Figure 4-29 Final output of the check printing report with spelled-out cash amounts
For more information on building this example, refer to Chapter 31, "Building a Check Printing Report with Spelled-Out Cash Amounts".
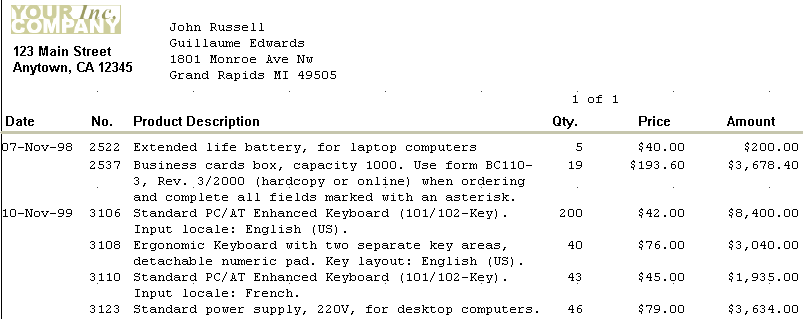
In this chapter, you will learn formatting techniques for printing reports on preprinted forms when you do not have access to a computer readable version of the forms. Such reports must be designed so that the data prints in exact positions on the form.
Figure 4-30 Final output of the preprinted forms example
For more information on building this example, refer to Chapter 32, "Building a Report Using a Preprinted Form".
In this example, you will build a report that displays several distinguishing characteristics of a typical invoice, such as customer name and address, sales order number, billing information, and billing totals.
Figure 4-31 Final output of the invoice report example

For more information on building this example, refer to Chapter 33, "Building an Invoice Report".
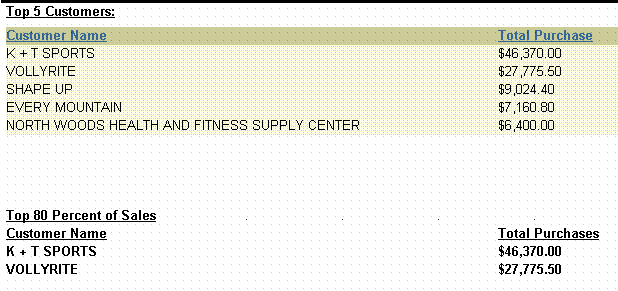
In this example, you will build a report that ranks data in two different ways: by count and by percentage. The upper portion displays the names and the total purchases of the top three customers; the lower portion displays the names and total purchases of those customers who constitute 75% of all sales. You can set the ranking criteria at runtime, or let them default to previously specified values.
Figure 4-32 Final output of the ranking report example
For more information on building this example, refer to Chapter 34, "Building a Ranking Report".
This example is designed to teach you how to add navigational items to a large paper report. You will learn how to create a group above report, then add a simple table of contents to the beginning of your report, which will enable users to find an item by its category. You will also learn how to create an index so users can directly find a specific piece of information.
For more details on building this example, refer to Chapter 35, "Building a Paper Report with a Simple Table of Contents and Index".
This example is designed to teach you how to add a multilevel table of contents to a large paper report. You will add a table of contents based on a category and sub-category to an existing paper report.
For more details on building this example, refer to Chapter 36, "Building a Paper Report with a Multilevel Table of Contents".
In this example, you will modify a simple report we have provided to burst each section to a separate report. You will then modify a sample distribution XML file to send an e-mail to each destination with an attachment based on the separate reports. You will also send multiple e-mails to the same e-mail address with a single attachment (the entire report).
For more information on building this example, refer to Chapter 37, "Bursting and Distributing a Report".
|
Note: No sample output is available for this report. |
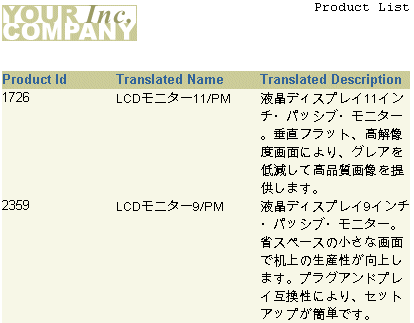
In this example, you will learn how to create a report in PDF format that contains multibyte characters for the Web and paper output. You will build a multibyte character set report using UTF8. You can produce reports that display text in multibyte character sets, such as Simplified Chinese, Traditional Chinese, Japanese, Korean, and Unicode.
Figure 4-36 Multibyte character set UTF8 report in Japanese
For more details on building this example, refer to Chapter 38, "Building a Report with Multibyte Characters for PDF Output".
This part of the manual explains how you can build reports using PL/SQL and Java.
In this example, you will learn how to use an external PL/SQL library and PL/SQL within a report to modify formatting and calculate the total compensation for each employee. In the sample output below, notice the spacing between records (for example, between the record for Alexander Khoo and the record for Alexis Bull). This space is not due to a break; it is the result of using a PL/SQL procedure in a format trigger.
Figure 4-37 Final output of the PL/SQL report example

For more information on building this example, refer to Chapter 39, "Building a Report that Includes PL/SQL".
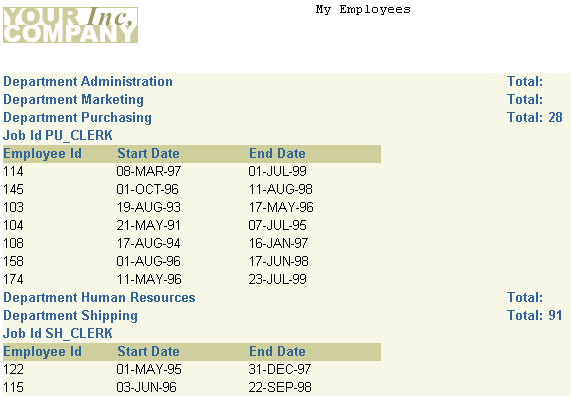
In this example, you will learn how to use Reports Builder's features for using REF CURSORs. To build this paper report, you will use the Data Model view to create a multiquery data model, and then use the Report Wizard to create the report layout. You will make fairly extensive manual refinements in the Data Model view.
Figure 4-38 Final output for the REF CURSORs example
For more information on building this example, refer to Chapter 40, "Building a Paper Report with REF CURSORs".
This example is designed to teach you how to build a simple JSP Parameter Form for a Web report. You will build a simple form in HTML, then create a JSP Parameter Form based on a data model in Reports Builder. You will then learn how to link the Parameter Form with an existing JSP-based Web report, then deploy and test both the JSP Parameter Form and the Web report through your browser.
Figure 4-40 JSP-based Web report based on a user parameter

For more details on building this example, refer to Chapter 41, "Building a Simple Parameter Form for a JSP-based Web Report".
In this example, you will build a report using the barcode Java bean in Oracle Reports. You will build two reports: one for paper and one for the Web. The paper report shows an invoice for a single customer who has ordered multiple items from a company. The barcode indicates the tracking information for the order.
Figure 4-41 Final output of the barcode report with paper layout
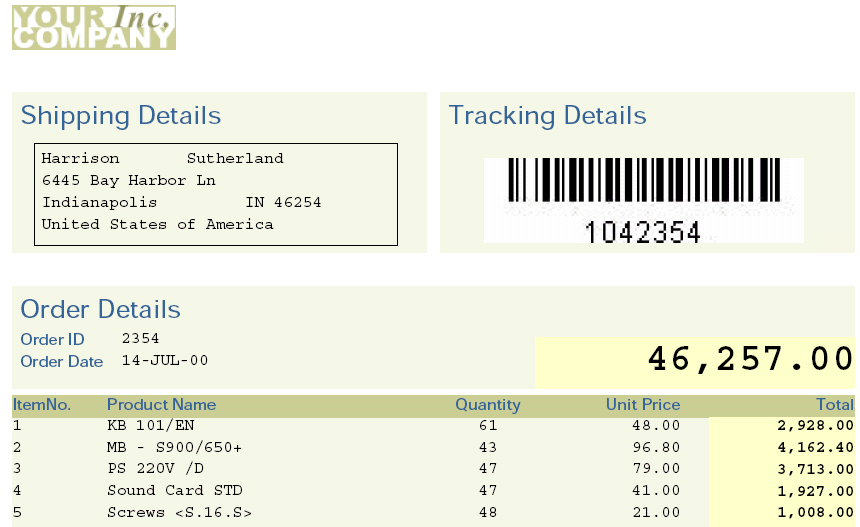
Figure 4-42 Final output of the barcode report with Web layout

For more details on building this example, refer to Chapter 42, "Building a Report with a Barcode".
In this example, you will use the properties in Oracle Reports to produce a JSP-based Web report that is accessible using assistive technology. You will learn how to modify an existing paper-based report to be accessible.
For more information on building this example, refer to Chapter 43, "Building an Accessible JSP-based Web Report".
|
Note: No sample output is available for this report. |
This part of the manual explains how you can build reports using Pluggable Data Sources.
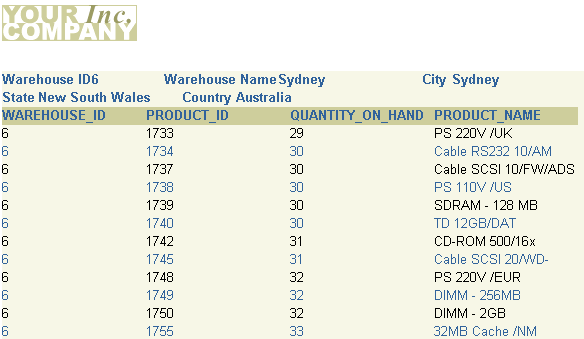
Reports Builder enables you to use any data source you wish. In this example, you will learn how to use the XML pluggable data source that is provided with Oracle Reports.
Figure 4-43 Final output of the XML PDS example
For more information on building this example, refer to Chapter 44, "Building a Report with an XML Pluggable Data Source".
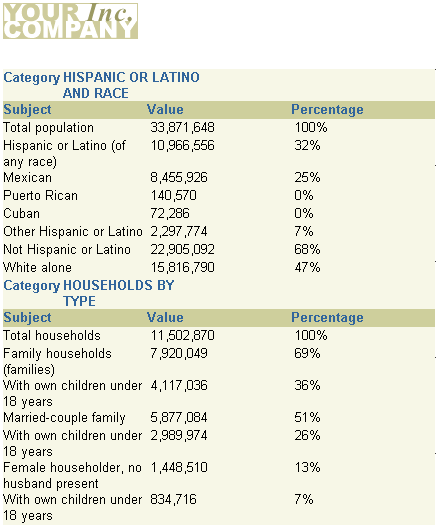
Reports Builder enables you to use any data source you wish. In this example, you will learn how to use character-delimited text as a data source.
Figure 4-44 Final output for the text PDS example
For more information on building this example, refer to Chapter 45, "Building a Report with a Text Pluggable Data Source".
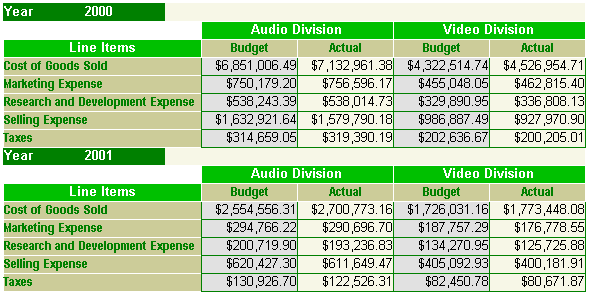
In this example, you will learn how to use the OLAP (Online Analytical Processing) PDS that is provided with Oracle Reports. You will build a report using OLAP data for a finance department. You will learn how to create a report for Web and paper layout based on OLAP data to compare budgeted vs. actual costs incurred.
Figure 4-45 Final output for the OLAP PDS example
For more information on building this example, refer to Chapter 46, "Building a Report with an OLAP Pluggable Data Source".
This example is designed to help you learn more about the Reports Builder features for Express data. You will build an Express report that summarizes the yearly projected and actual sales for each region and sales channel in a product division.
To build this report, you will use the Report Wizard to create the initial data model and report layout. You will make refinements to the data model and to the Express query. Finally, you will enhance the look of the report in the Paper Layout view and in the Paper Design view.
Figure 4-46 Final output for the Express data example
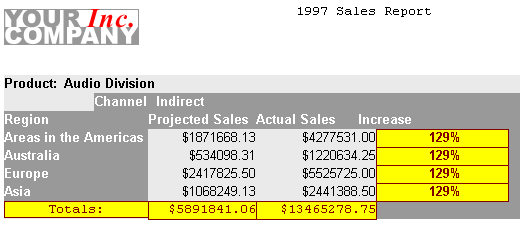
For more information on building this example, refer to Chapter 47, "Building a Report Using Oracle Express Data".
In this chapter, each of the example reports contained in this manual are described. For more details on each of the examples, refer the location provided. For access to the latest versions of the documentation and example files, visit the Oracle Technology Network (OTN): on the Oracle Reports 10g page (http://www.oracle.com/technology/products/reports/index.html), click Getting Started to display the Getting Started with Oracle Reports home page.